
 Facebook
 X
X
 Pinterest
 Copy Link
July 2023 Update

DID YOU KNOW?
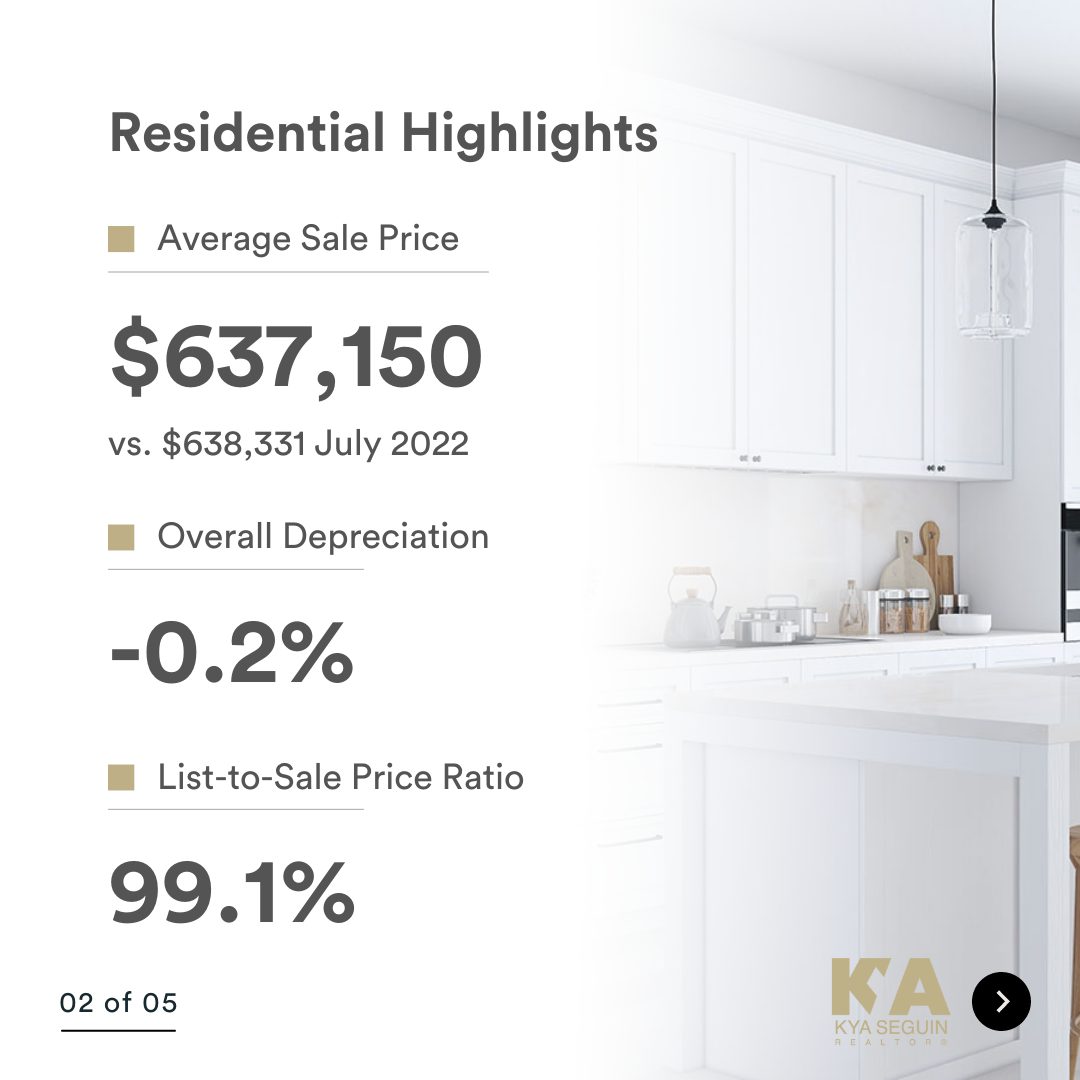
- The average sale price is DOWN 0.2% from this time last year
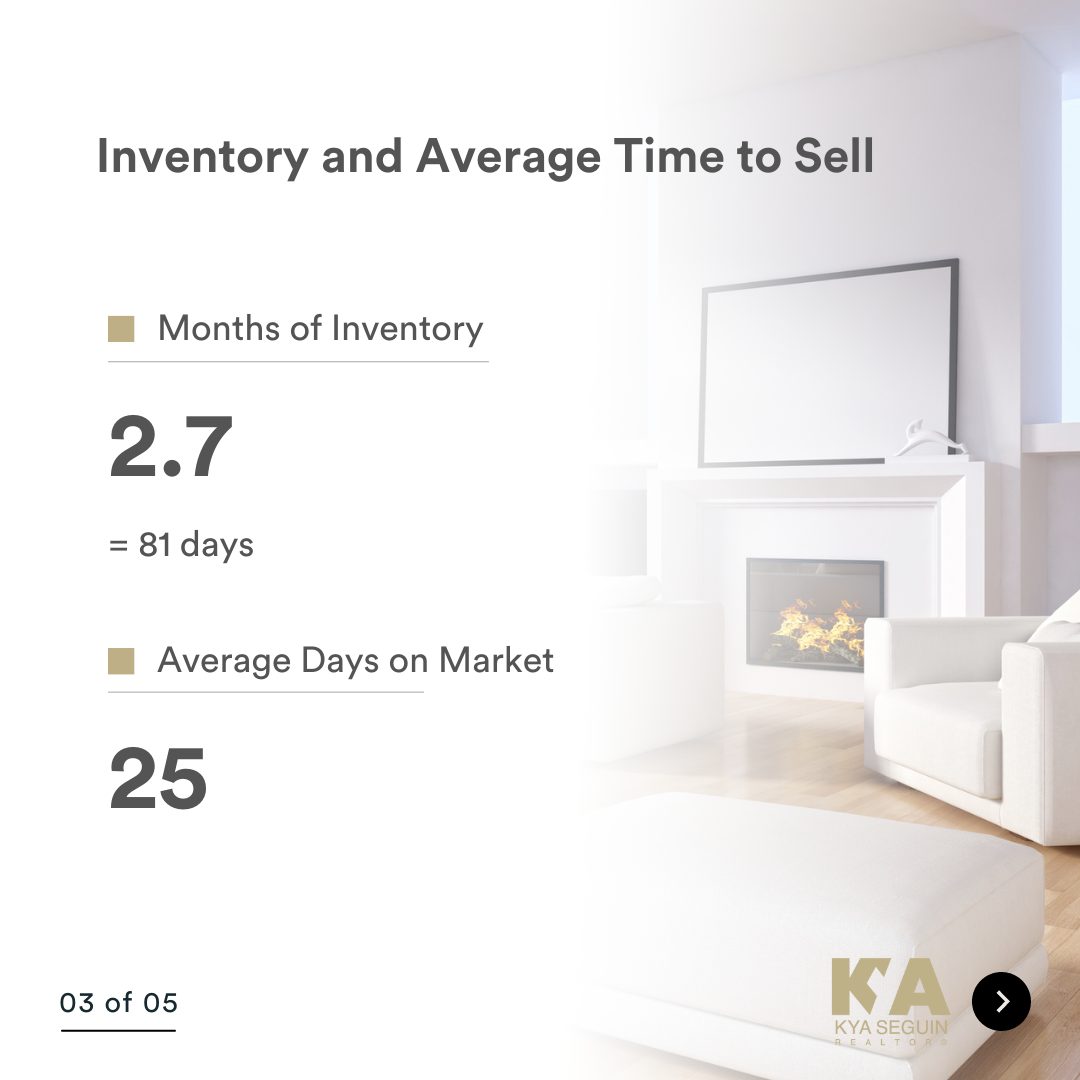
- Inventory levels have slowed down (which is typical for July / summer), with 2.7 months of inventory in the City of Peterborough (that means it would take 81 days to completely sell the homes that are currently listed for sale in the city, based on the the current rate of sales activity)
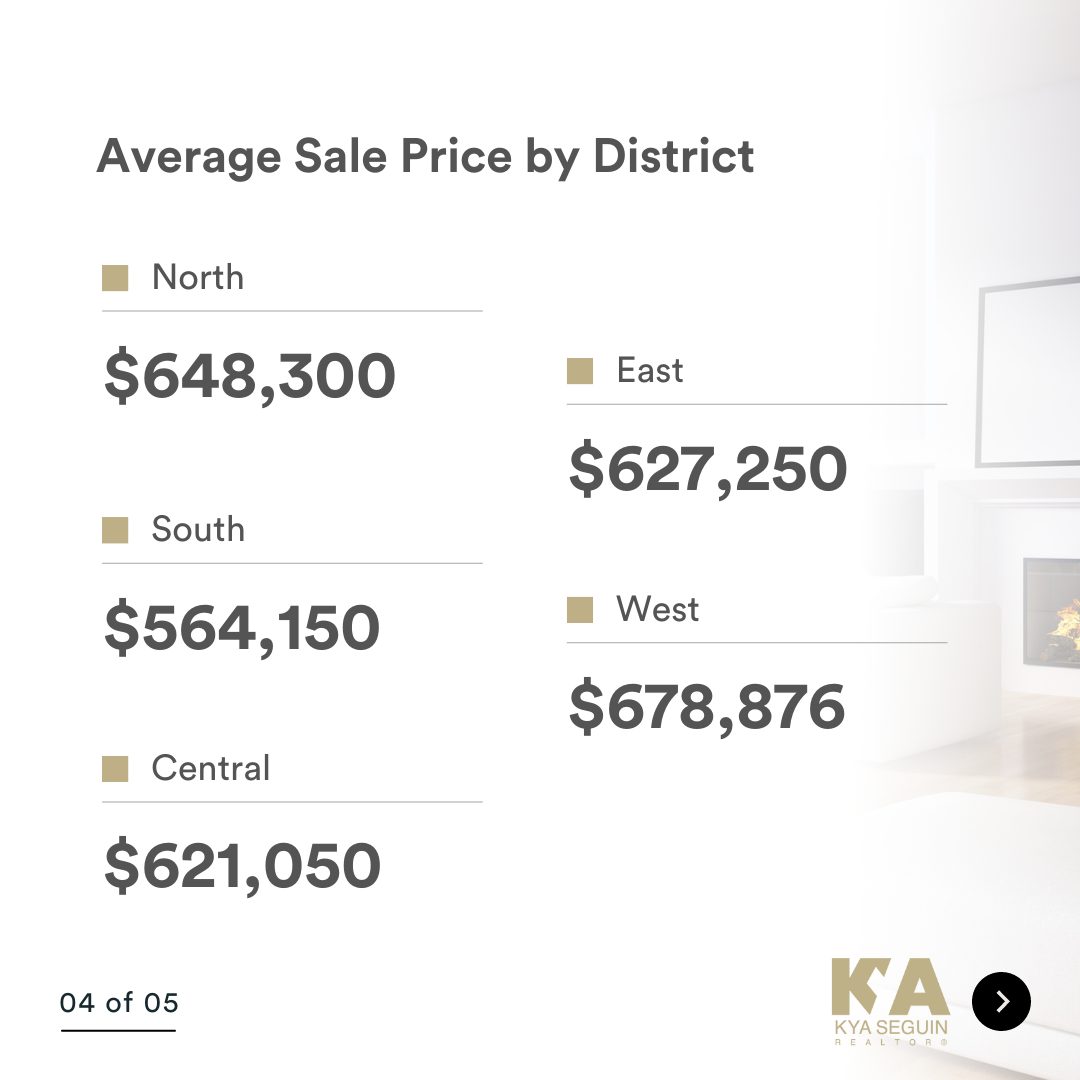
- Houses in the North end of Peterborough are selling the most – with 18 sales last month
** Important to Note:
- When months of inventory goes up, prices come down, and when months of inventory goes down, prices go up (the law of supply and demand)
- A seller’s market = 4 months of inventory or less and a balanced market = 4-6 months of inventory.
![]() Cover photo credit: Brian Parypa
Cover photo credit: Brian Parypa
July 2022 Update

DID YOU KNOW?
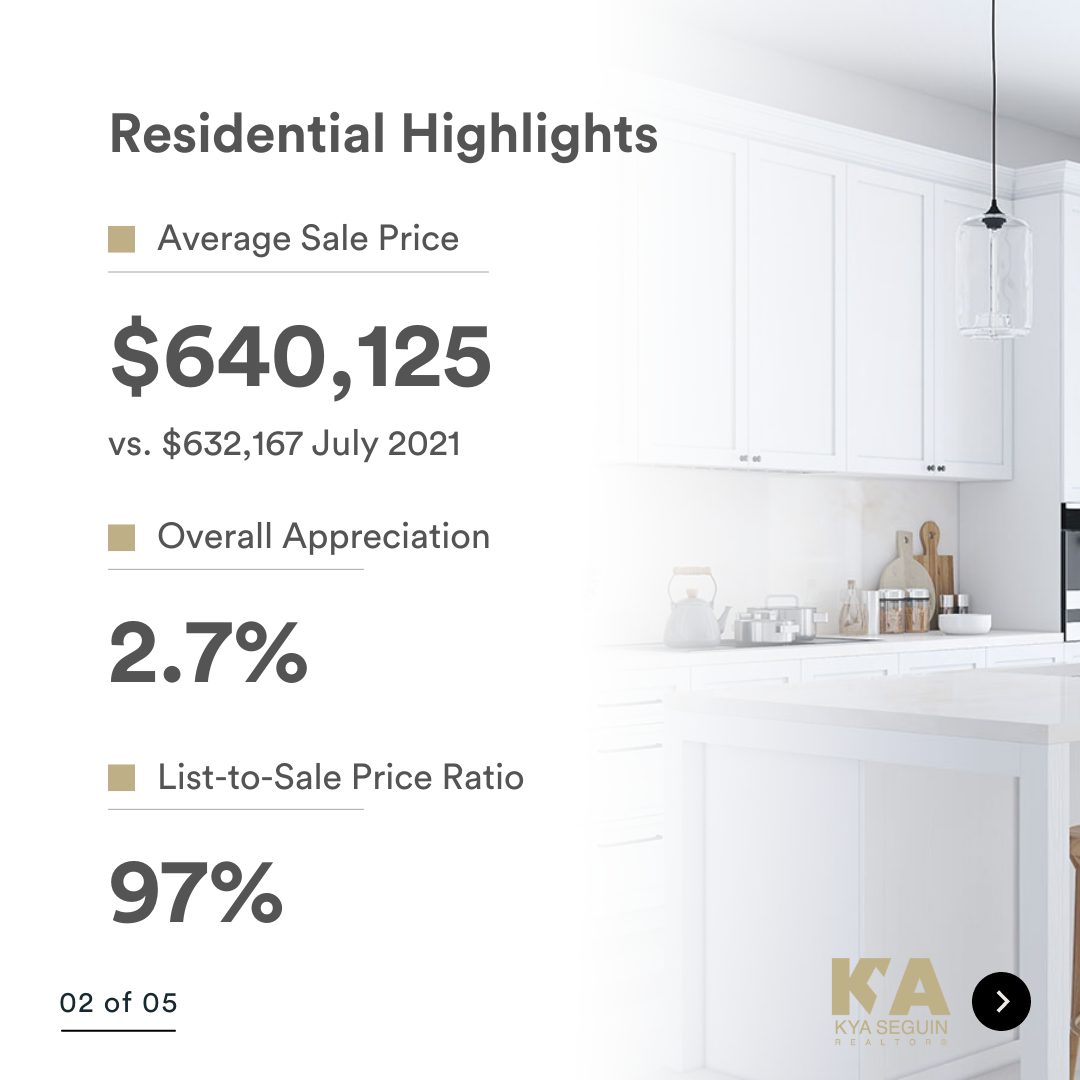
– The average sale price is up 2.7% from this time last year (things are starting to level out from the peak in February)
– Inventory levels continue to be in favour of Sellers, however, there is quite a shift in the market, with 2.47 months of inventory in the City of Peterborough (that means it would take 74 days to completely sell the homes that are currently listed for sale in the city, based on the the current rate of sales activity)
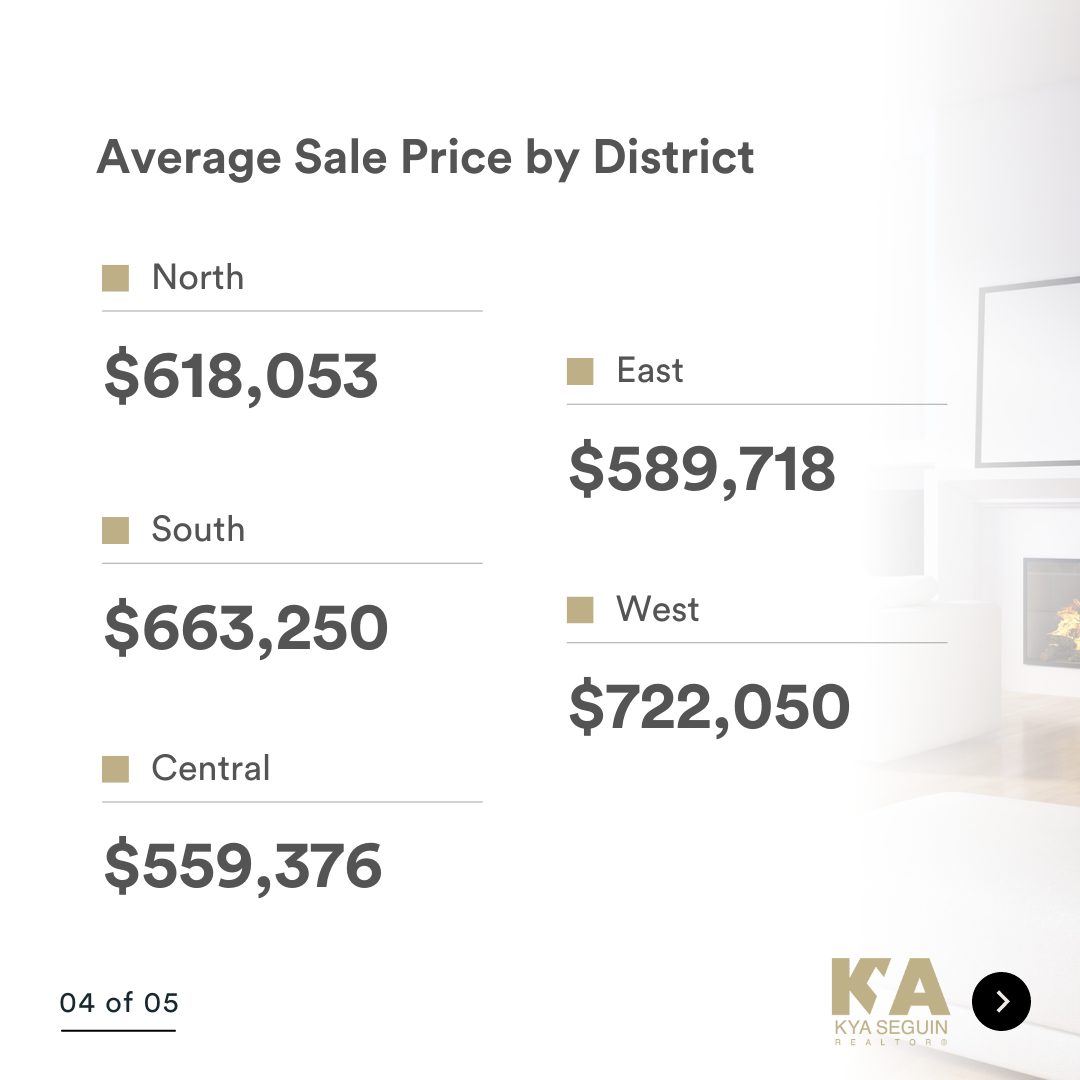
– Houses in the West end of Peterborough are selling the most – with 29 sales last month
The market is shifting and prices are a little more reasonable now vs. earlier this year (the average sale price is down about 17% from the peak in February). Price decreases are happening, there is more inventory, longer days on market and not as many sellers “holding offers” as before (more are listing closer to market value and reviewing offers any time).
Take a look at the market snapshot for July 2022, and reach out if you have any questions. Whether you are buying, selling, investing, or just daydreaming about a new home, I can help you make an informed decision.
![]() Drone cover photo credit: Fine Homes Photography
Drone cover photo credit: Fine Homes Photography


July 2021 Update

DID YOU KNOW?
– The average sale price is up 35% from this time last year
– Inventory levels continue to be in favour of Sellers, with 0.6 months of inventory in the City of Peterborough (that means it would take 19 days to completely sell the homes that are currently listed for sale in the city, based on the the current rate of sales activity)
– Houses in the West end of Peterborough are selling the most – with 37 sales last month
– Record-low mortgage rates, pent-up buyer demand, low inventory and relocations made possible by remote work have all contributed to strong sales and price appreciation during Covid-19
Take a look at the local stats for July 2021, and reach out if you have any questions. Whether you are buying, selling, or just daydreaming about a new home, I can help you make an informed decision.


