Facebook
 X
X
 Pinterest
 Copy Link
Peterborough Real Estate Stats •
June 13, 2025
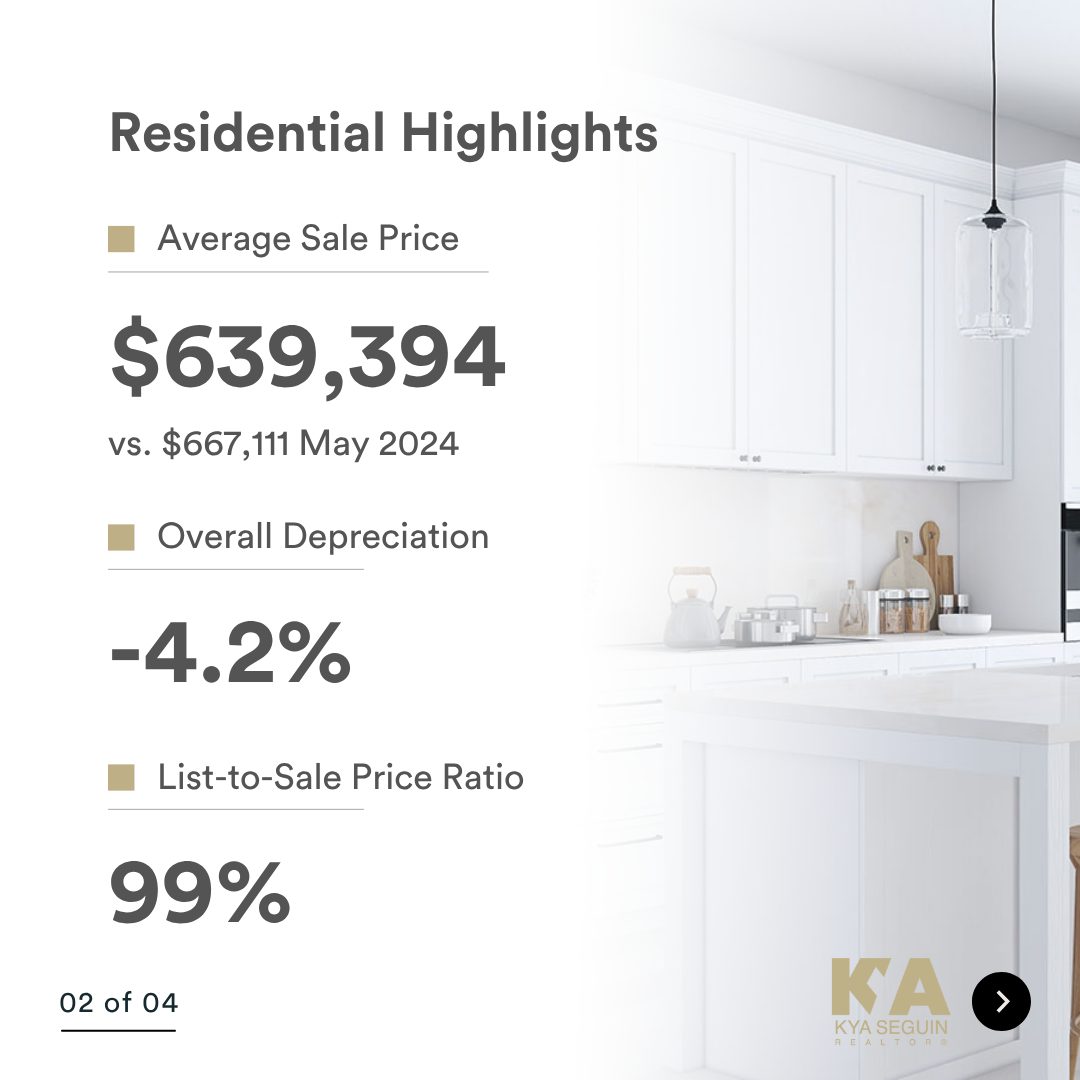
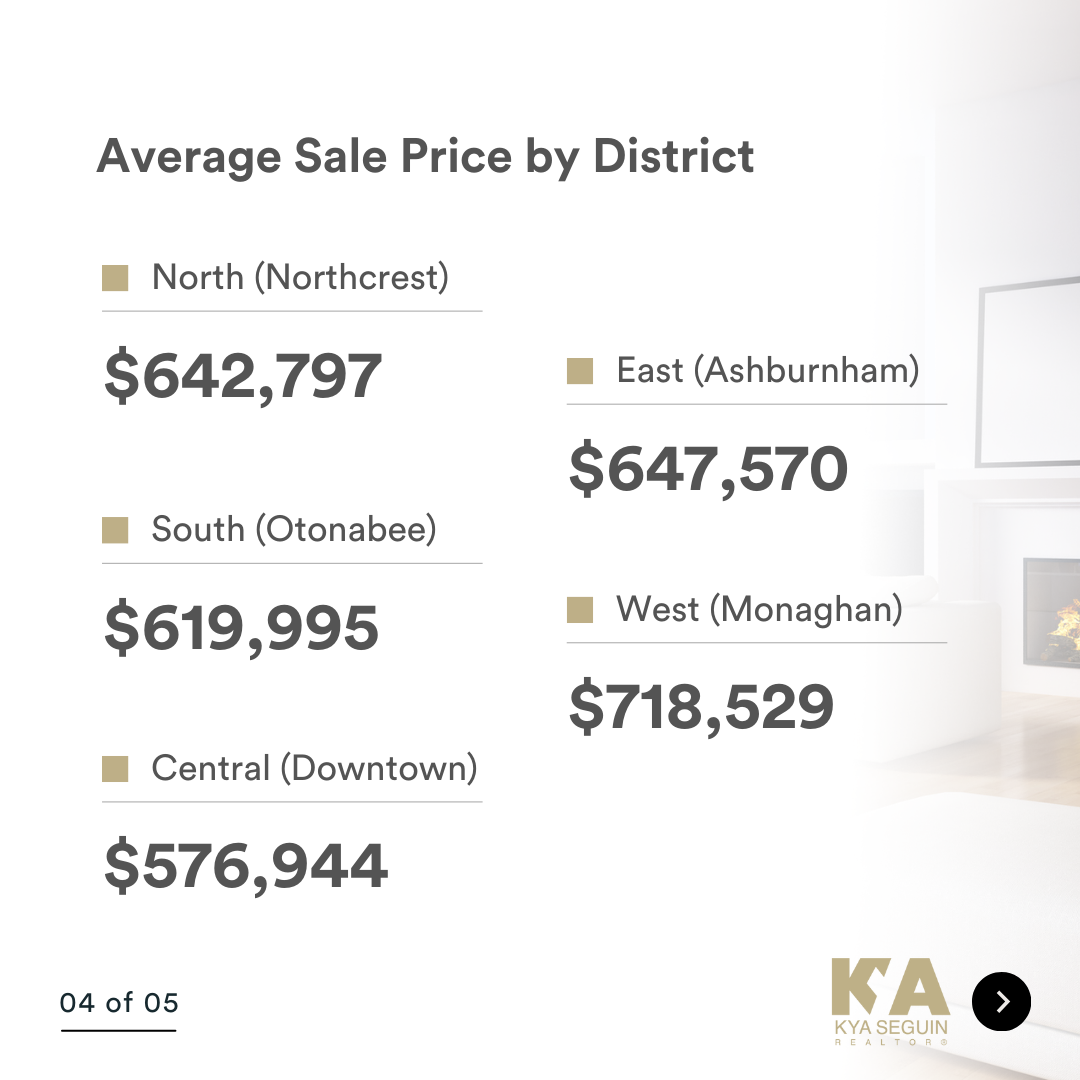
May 2025 Update

DID YOU KNOW?
- The average sale price is DOWN 4.2% from this time last year
- Inventory levels are still in favour of Sellers, but we are nearing a balanced market – with 2.9 months of inventory in the City of Peterborough (that means it would take 87 days to completely sell the homes that are currently listed for sale in the city, based on the the current rate of sales activity)
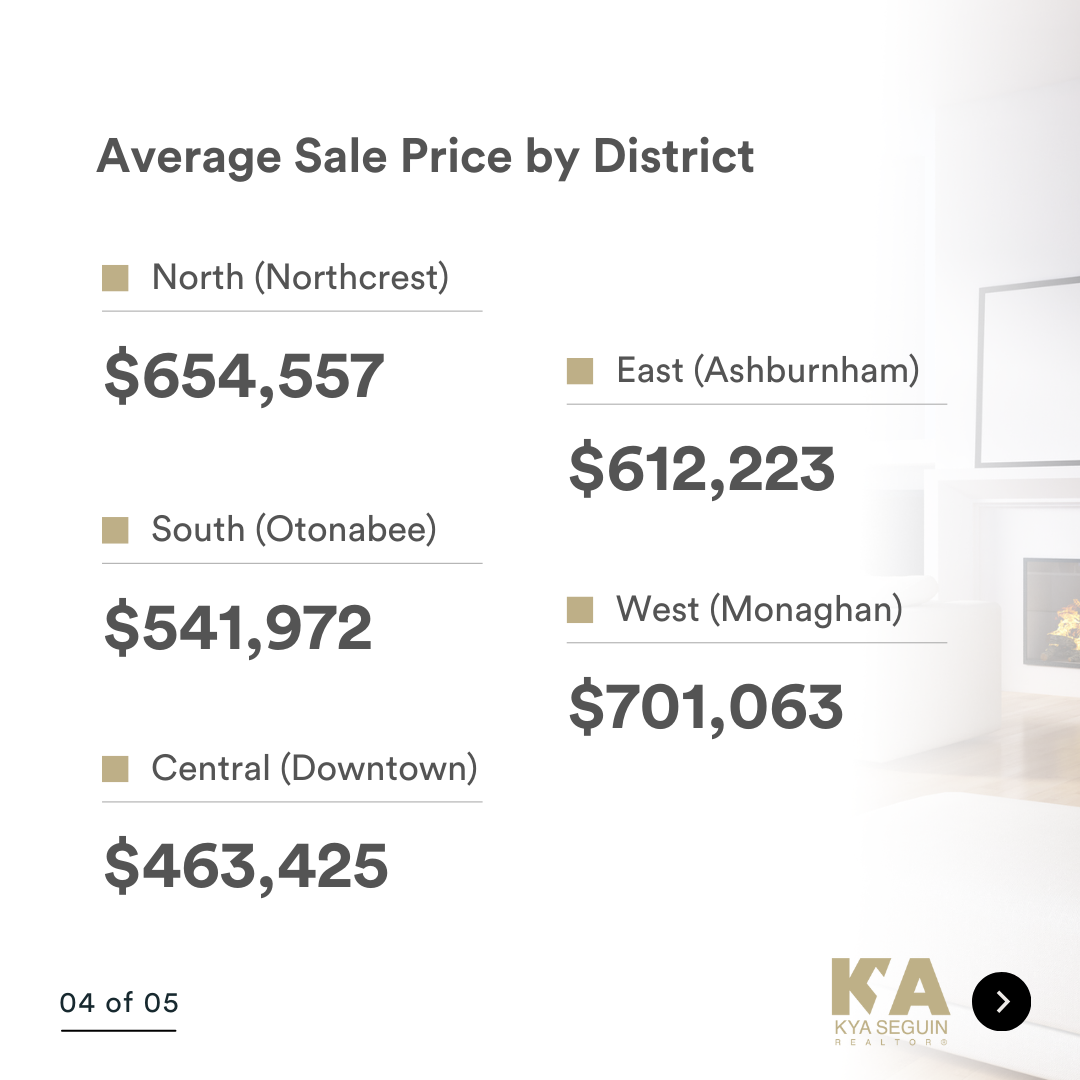
- Properties in the North end of Peterborough are selling the most – with 25 sales last month
** Important to Note:
- When months of inventory goes up, prices come down, and when months of inventory goes down, prices go up (the law of supply and demand)
- A seller’s market = 4 months of inventory or less and a balanced market = 4-6 months of inventory.
Take a look at the market snapshot for May 2025, and reach out if you have any questions. Whether you are buying, selling, investing or just daydreaming about a new home, I can help you make an informed decision.
![]() Cover photo credit: Brian Parypa
Cover photo credit: Brian Parypa


Peterborough Real Estate Stats •
May 15, 2025
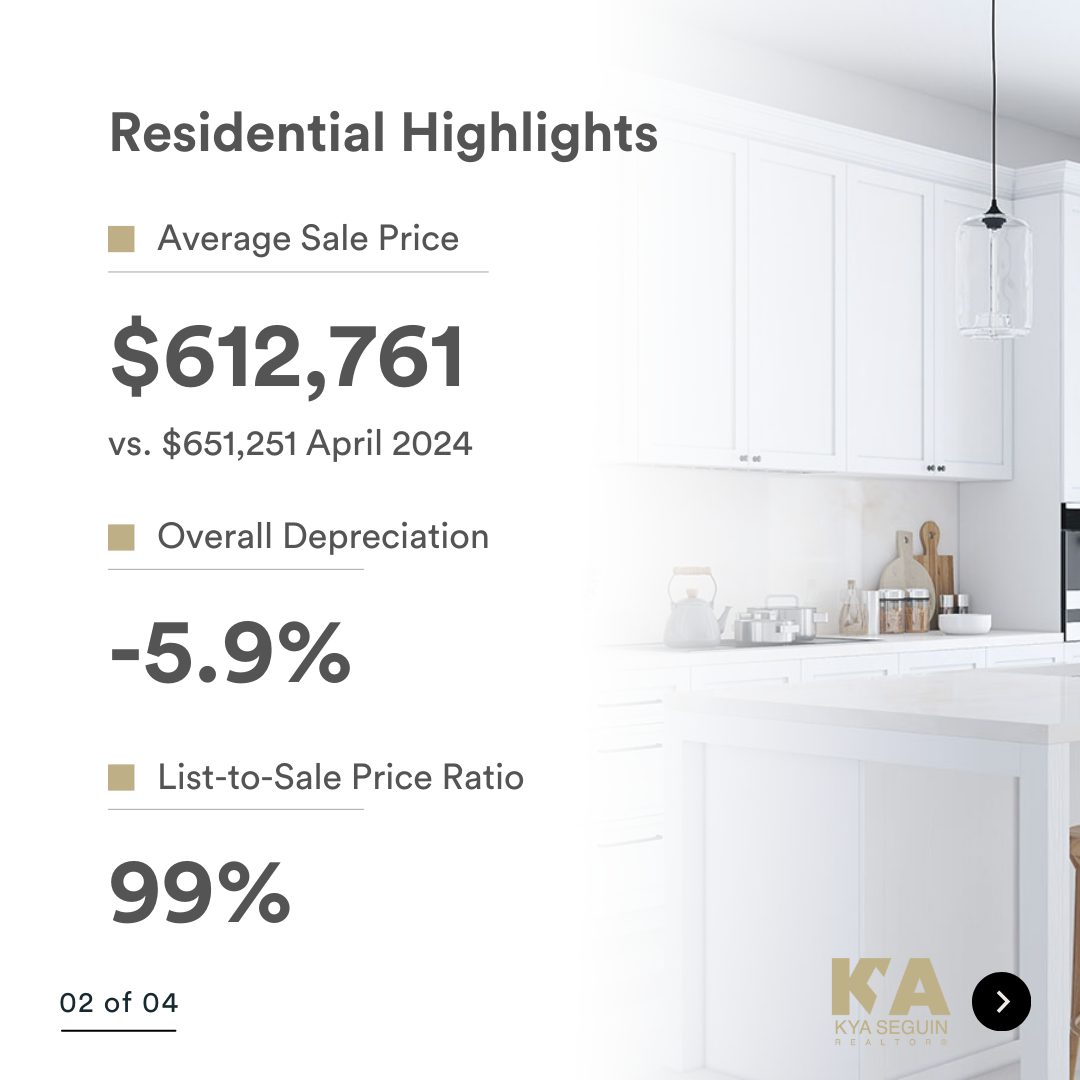
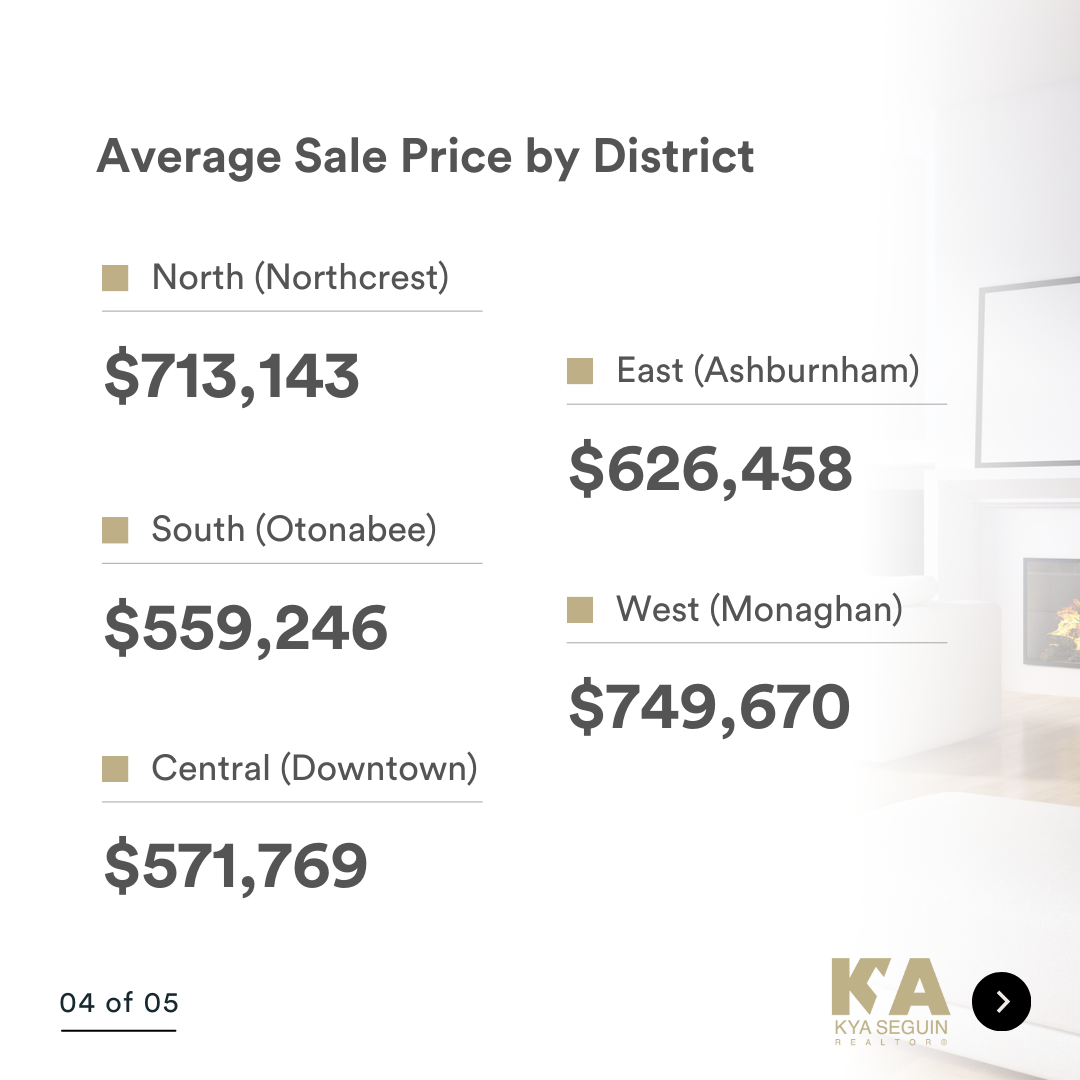
April 2025 Update

DID YOU KNOW?
- The average sale price is DOWN 5.9% from this time last year
- Inventory levels are still in favour of Sellers, with 2.4 months of inventory in the City of Peterborough (that means it would take 72 days to completely sell the homes that are currently listed for sale in the city, based on the the current rate of sales activity)
- Properties in the North and South ends of Peterborough are selling the most – each with 27 sales last month
** Important to Note:
- When months of inventory goes up, prices come down, and when months of inventory goes down, prices go up (the law of supply and demand)
- A seller’s market = 4 months of inventory or less and a balanced market = 4-6 months of inventory.
Take a look at the market snapshot for April 2025, and reach out if you have any questions. Whether you are buying, selling, investing or just daydreaming about a new home, I can help you make an informed decision.

Peterborough Real Estate Stats •
March 16, 2025
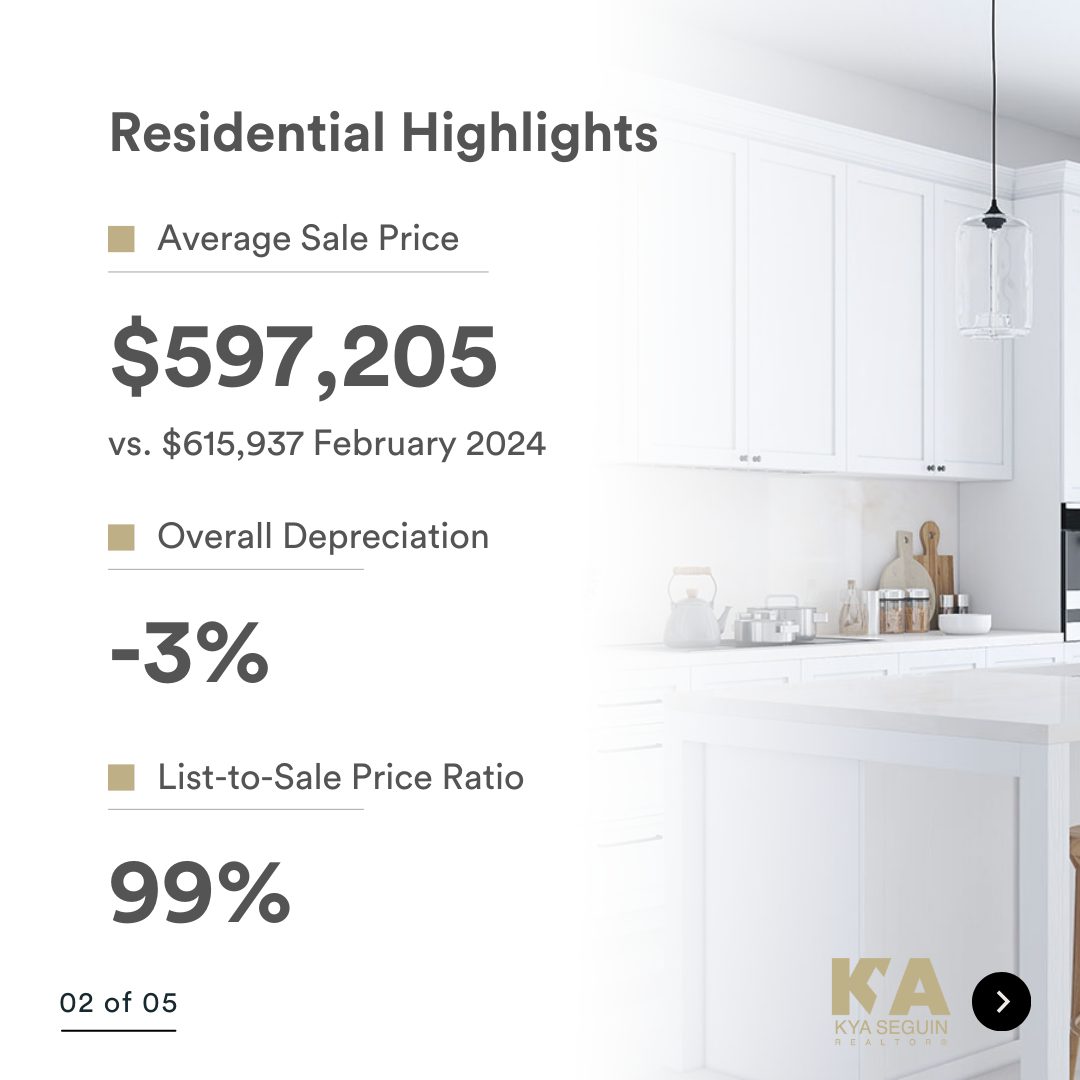
February 2025 Update

DID YOU KNOW?
- The average sale price is DOWN 3% from this time last year
-
Inventory levels are still in favour of Sellers, with 2.9 months of inventory in the City of Peterborough (that means it would take 86 days to completely sell the homes that are currently listed for sale in the city, based on the the current rate of sales activity)
-
Properties in the North and South ends of Peterborough are selling the most – each with 13 sales last month
** Important to Note:
- When months of inventory goes up, prices come down, and when months of inventory goes down, prices go up (the law of supply and demand)
- A seller’s market = 4 months of inventory or less and a balanced market = 4-6 months of inventory.
Take a look at the market snapshot for February 2025, and reach out if you have any questions. Whether you are buying, selling, investing or just daydreaming about a new home, I can help you make an informed decision.
![]() Cover photo credit: Brian Parypa
Cover photo credit: Brian Parypa


Peterborough Real Estate Stats •
February 13, 2025
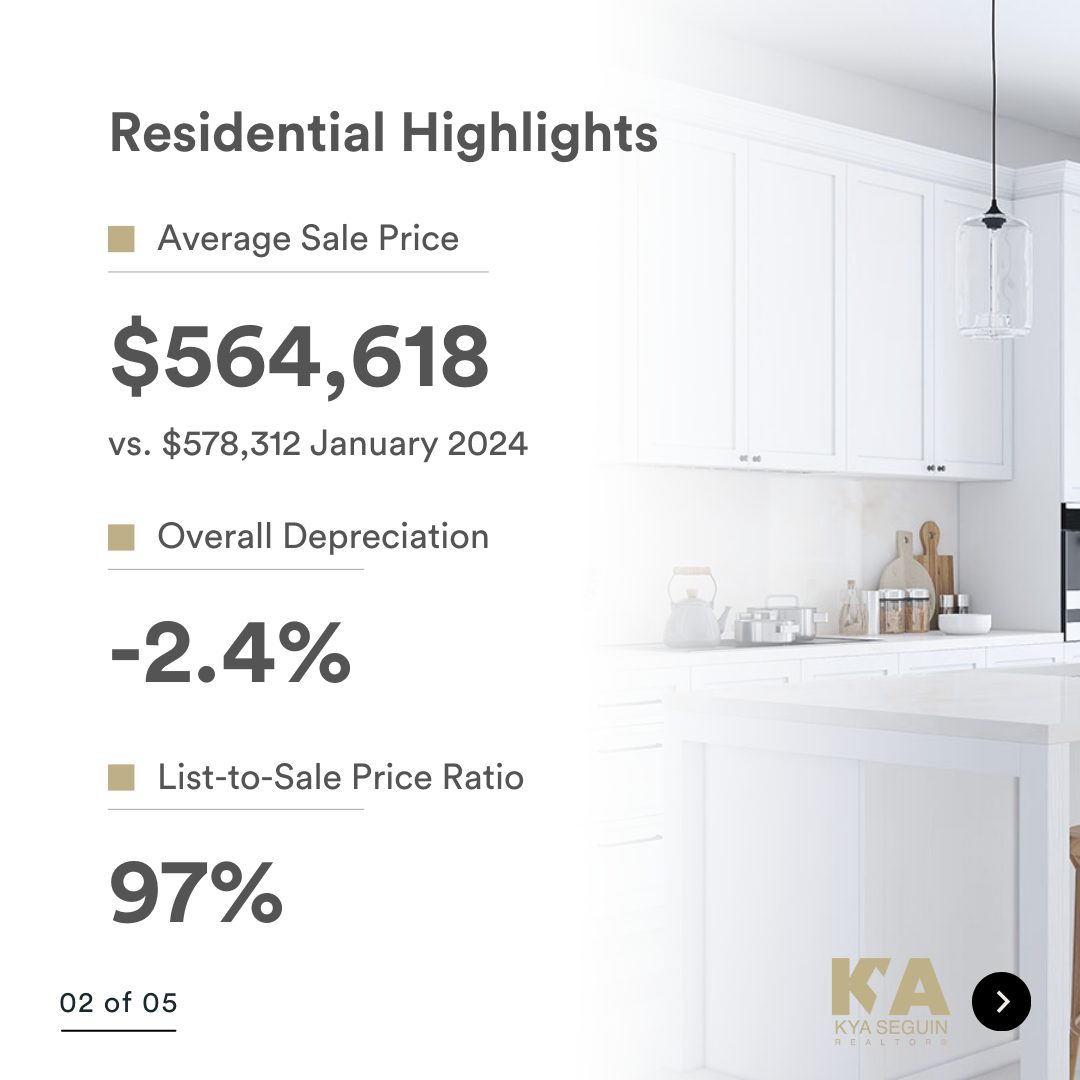
January 2025 Update

DID YOU KNOW?
- The average sale price is DOWN 2.4% from this time last year
-
Inventory levels are still in favour of Sellers, with 2.5 months of inventory in the City of Peterborough (that means it would take 75 days to completely sell the homes that are currently listed for sale in the city, based on the the current rate of sales activity)
-
Houses in the East end of Peterborough are selling the most – with 26 sales last month
** Important to Note:
- When months of inventory goes up, prices come down, and when months of inventory goes down, prices go up (the law of supply and demand)
- A seller’s market = 4 months of inventory or less and a balanced market = 4-6 months of inventory.
Take a look at the market snapshot for January 2025, and reach out if you have any questions. Whether you are buying, selling, investing or just daydreaming about a new home, I can help you make an informed decision.
![]() Cover photo credit: Brian Parypa
Cover photo credit: Brian Parypa

Peterborough Real Estate Stats •
October 18, 2024
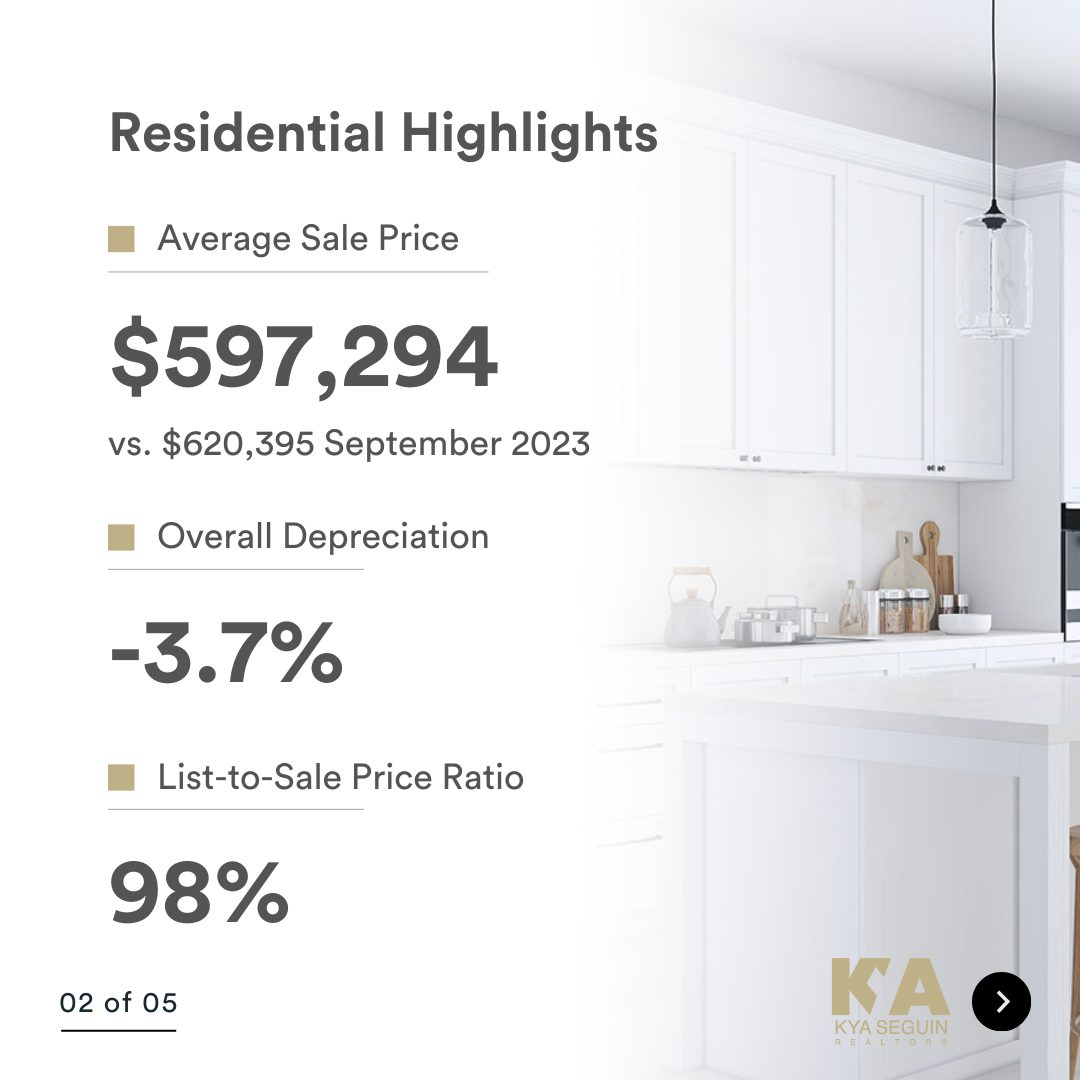
September 2024 Update

DID YOU KNOW?
- The average sale price is DOWN 3.7% from this time last year
-
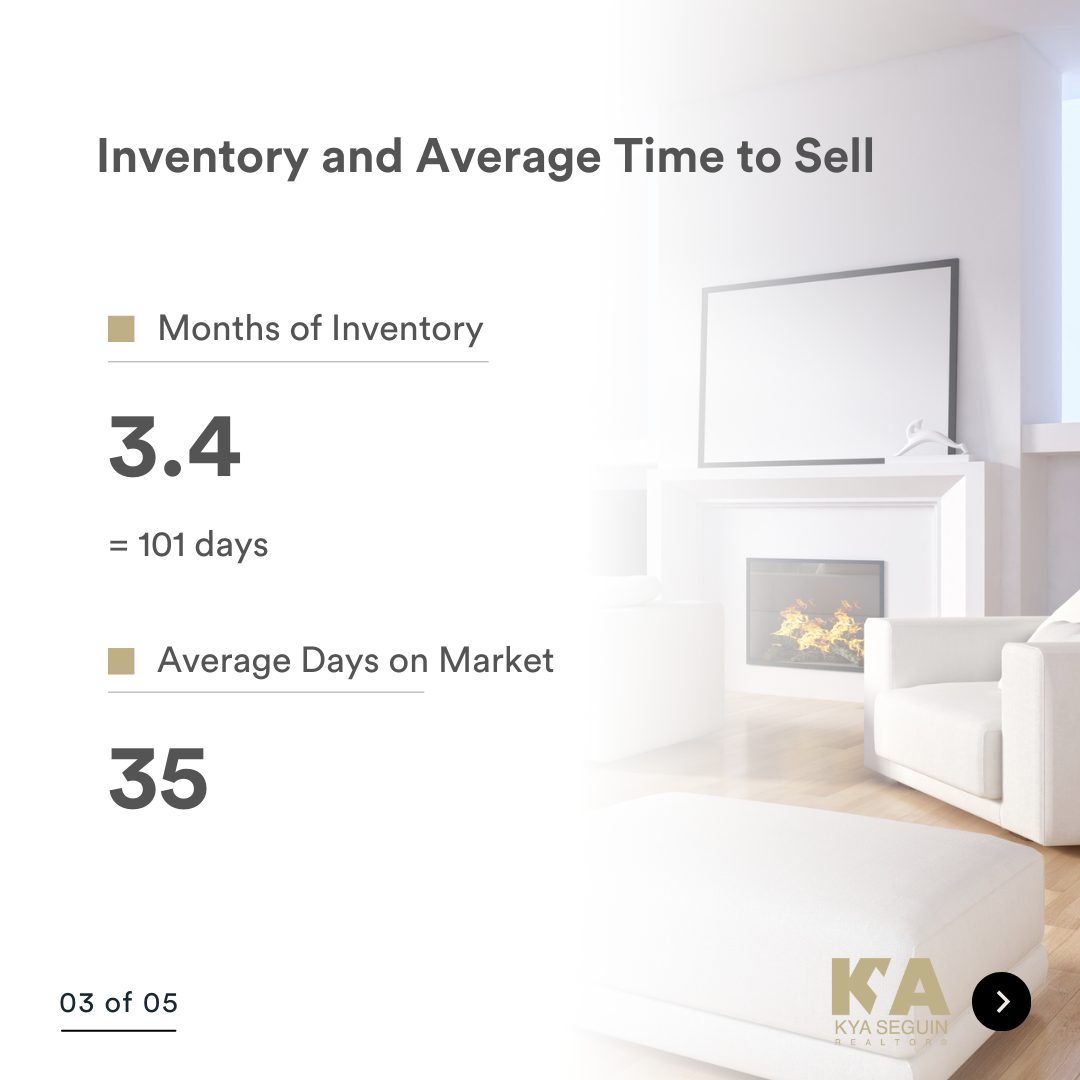
Inventory levels are still in favour of Sellers, with 3.4 months of inventory in the City of Peterborough (that means it would take 101 days to completely sell the homes that are currently listed for sale in the city, based on the the current rate of sales activity)
-
Houses in the North end of Peterborough are selling the most – with 23 sales last month
** Important to Note:
- When months of inventory goes up, prices come down, and when months of inventory goes down, prices go up (the law of supply and demand)
- A seller’s market = 4 months of inventory or less and a balanced market = 4-6 months of inventory.
Take a look at the market snapshot for September 2024, and reach out if you have any questions. Whether you are buying, selling, investing or just daydreaming about a new home, I can help you make an informed decision.
Peterborough Real Estate Stats •
September 16, 2024
August 2024 Update

DID YOU KNOW?
- The average sale price is DOWN 9.1% from this time last year
-
Inventory levels are still in favour of Sellers, with 2.8 months of inventory in the City of Peterborough (that means it would take 83 days to completely sell the homes that are currently listed for sale in the city, based on the the current rate of sales activity)
-
Houses in the West end of Peterborough are selling the most – with 23 sales last month
** Important to Note:
- When months of inventory goes up, prices come down, and when months of inventory goes down, prices go up (the law of supply and demand)
- A seller’s market = 4 months of inventory or less and a balanced market = 4-6 months of inventory.
Take a look at the market snapshot for August 2024, and reach out if you have any questions. Whether you are buying, selling, investing or just daydreaming about a new home, I can help you make an informed decision.
![]() Cover photo credit: Brian Parypa
Cover photo credit: Brian Parypa


Peterborough Real Estate Stats •
August 27, 2024
July 2024 Update

DID YOU KNOW?
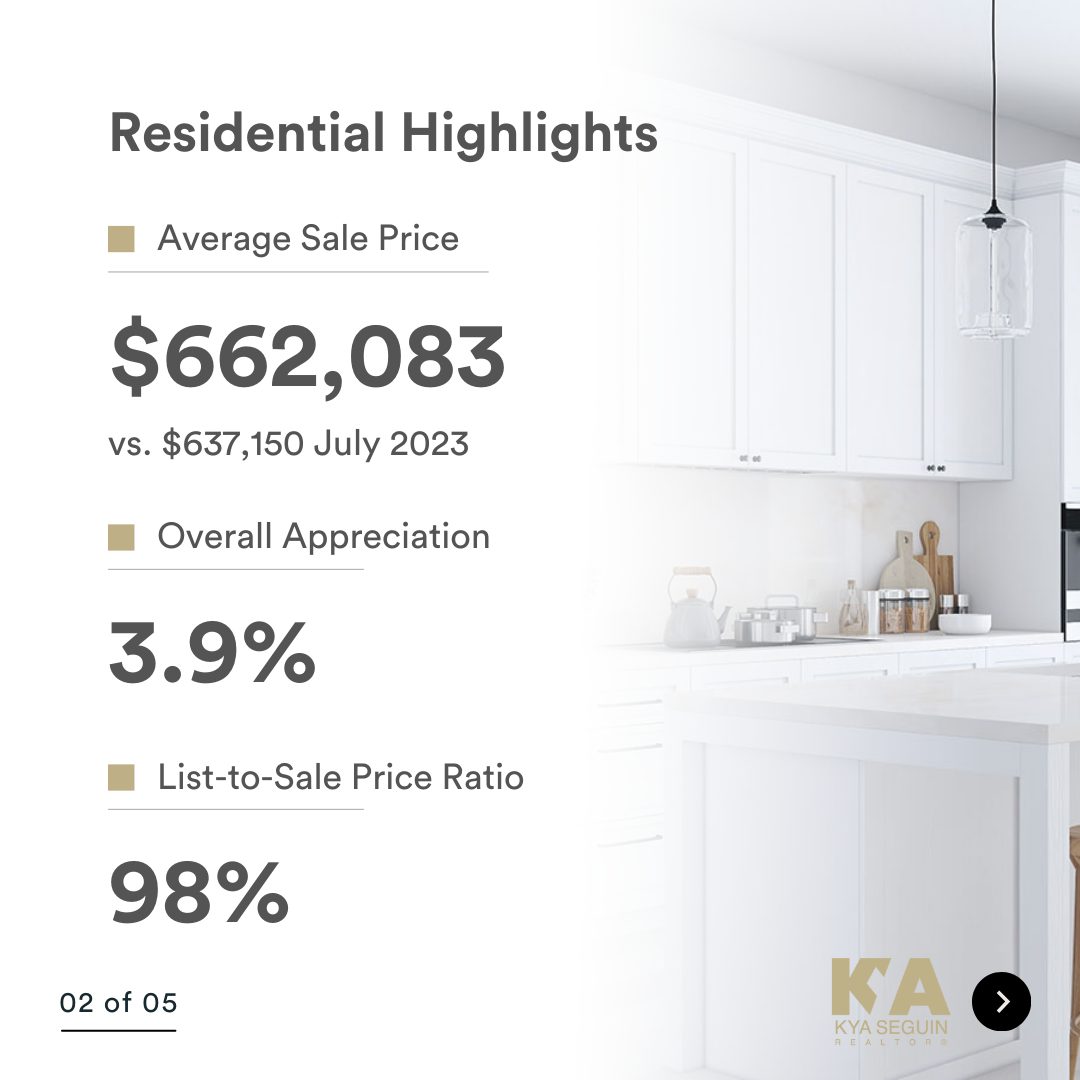
- The average sale price is UP 3.9% from this time last year
-
Inventory levels are still in favour of Sellers, with 2.9 months of inventory in the City of Peterborough (that means it would take 87 days to completely sell the homes that are currently listed for sale in the city, based on the the current rate of sales activity)
-
Houses in the North end of Peterborough are selling the most – with 28 sales last month
** Important to Note:
- When months of inventory goes up, prices come down, and when months of inventory goes down, prices go up (the law of supply and demand)
- A seller’s market = 4 months of inventory or less and a balanced market = 4-6 months of inventory.
Take a look at the market snapshot for July 2024, and reach out if you have any questions. Whether you are buying, selling, investing or just daydreaming about a new home, I can help you make an informed decision.

Peterborough Real Estate Stats •
July 11, 2024
June 2024 Update

DID YOU KNOW?
- The average sale price is DOWN 2% from this time last year
-
Inventory levels are still in favour of Sellers, with 2.5 months of inventory in the City of Peterborough (that means it would take 75 days to completely sell the homes that are currently listed for sale in the city, based on the the current rate of sales activity)
-
Houses in the West end of Peterborough are selling the most – with 29 sales last month
** Important to Note:
- When months of inventory goes up, prices come down, and when months of inventory goes down, prices go up (the law of supply and demand)
- A seller’s market = 4 months of inventory or less and a balanced market = 4-6 months of inventory.
Take a look at the market snapshot for June 2024, and reach out if you have any questions. Whether you are buying, selling, investing or just daydreaming about a new home, I can help you make an informed decision.


Peterborough Real Estate Stats •
June 14, 2024
May 2024 Update

DID YOU KNOW?
- The average sale price is UP 3.6% from this time last year
-
Inventory levels are still in favour of Sellers, with 2.2 months of inventory in the City of Peterborough (that means it would take 67 days to completely sell the homes that are currently listed for sale in the city, based on the the current rate of sales activity)
-
Houses in the West end of Peterborough are selling the most – with 38 sales last month
** Important to Note:
- When months of inventory goes up, prices come down, and when months of inventory goes down, prices go up (the law of supply and demand)
- A seller’s market = 4 months of inventory or less and a balanced market = 4-6 months of inventory.
Take a look at the market snapshot for May 2024, and reach out if you have any questions. Whether you are buying, selling, investing or just daydreaming about a new home, I can help you make an informed decision.


Peterborough Real Estate Stats •
May 13, 2024
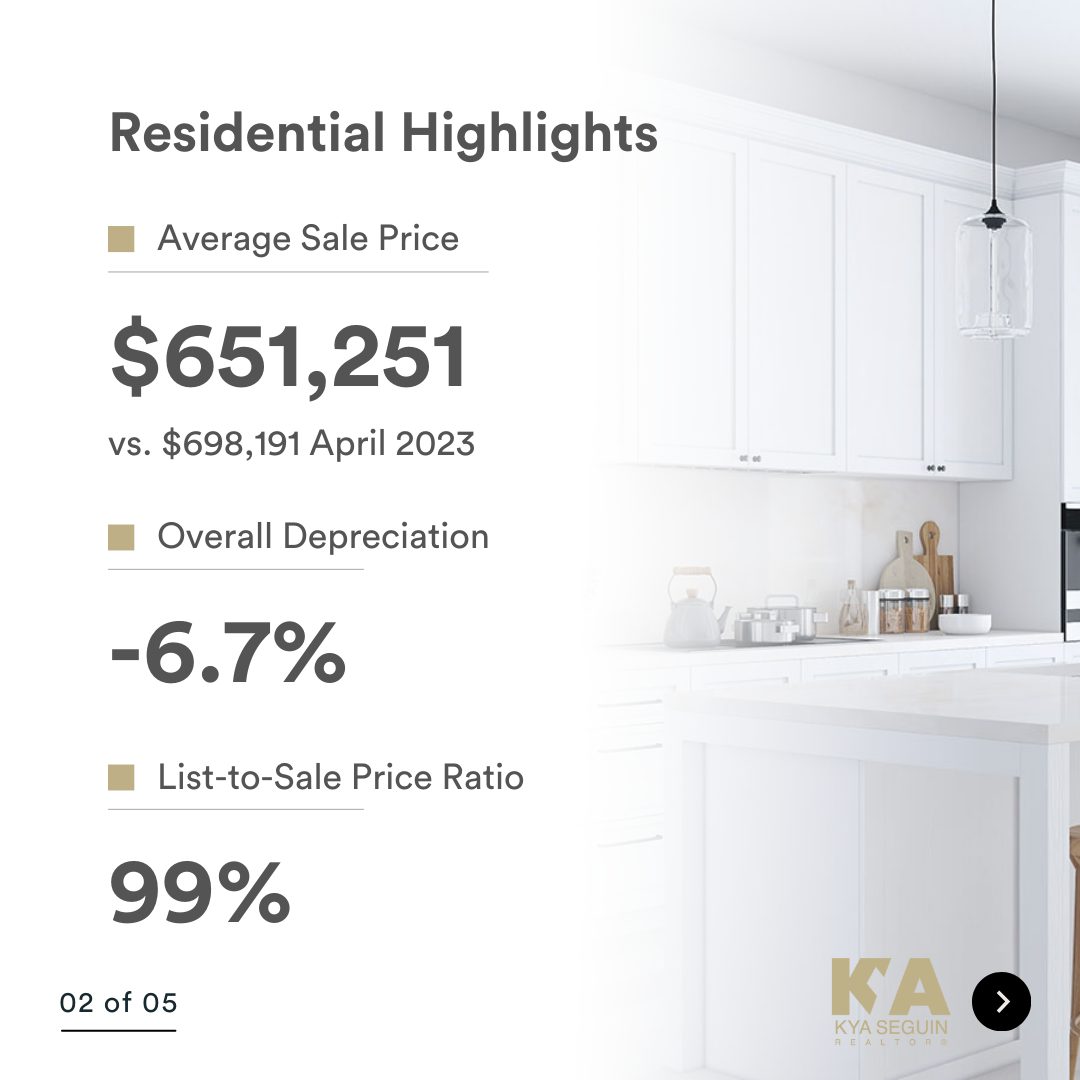
April 2024 Update

DID YOU KNOW?
- The average sale price is DOWN 6.7% from this time last year
-
Inventory levels are in favour of Sellers, with 1.8 months of inventory in the City of Peterborough (that means it would take 54 days to completely sell the homes that are currently listed for sale in the city, based on the the current rate of sales activity)
-
Houses in the West end of Peterborough are selling the most – with 29 sales last month
** Important to Note:
- When months of inventory goes up, prices come down, and when months of inventory goes down, prices go up (the law of supply and demand)
- A seller’s market = 4 months of inventory or less and a balanced market = 4-6 months of inventory.
Take a look at the market snapshot for April 2024, and reach out if you have any questions. Whether you are buying, selling, investing or just daydreaming about a new home, I can help you make an informed decision.
![]() Cover photo credit: Brian Parypa
Cover photo credit: Brian Parypa