Facebook
 X
X
 Pinterest
 Copy Link
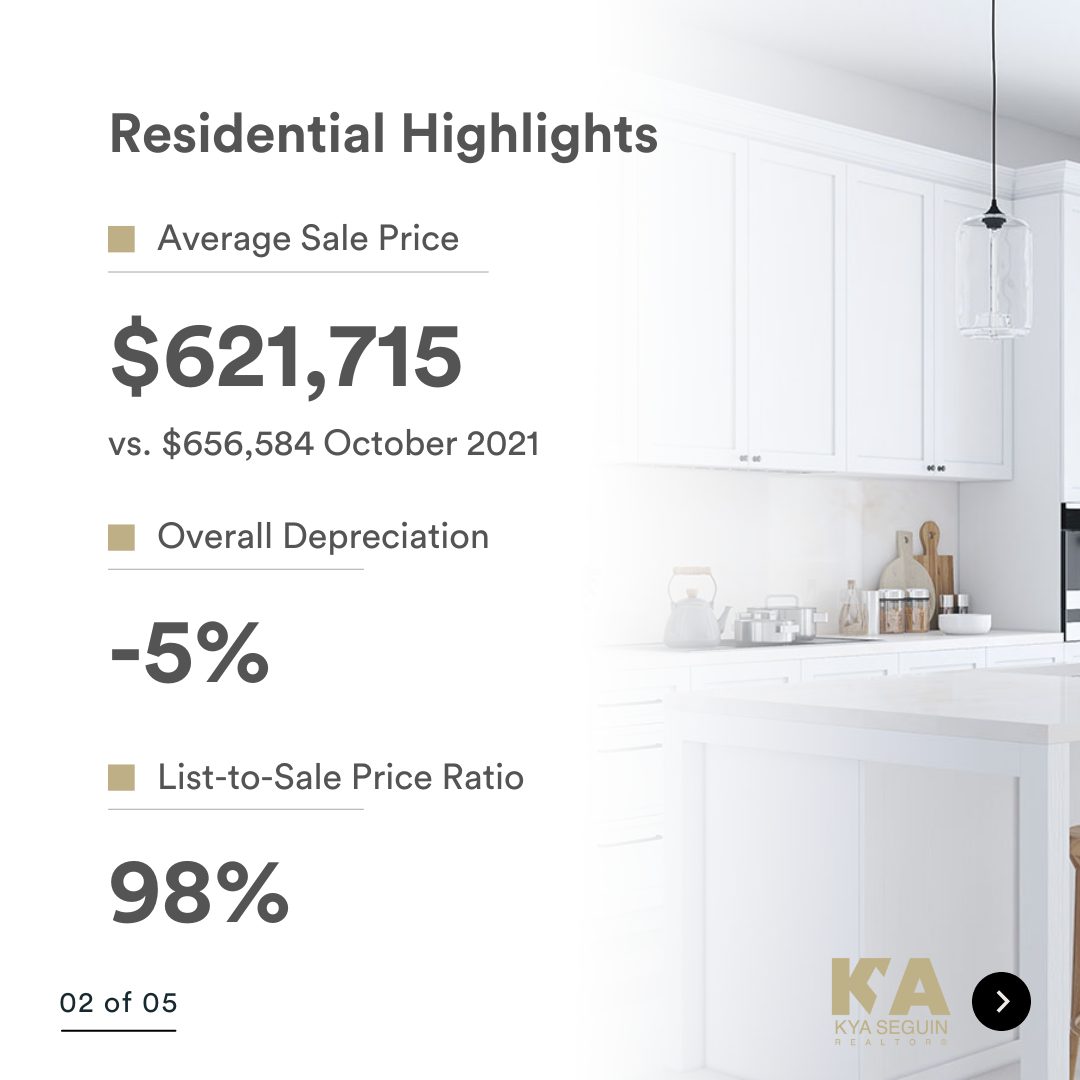
October 2022 Update

DID YOU KNOW?
– The average sale price is DOWN 5% from this time last year
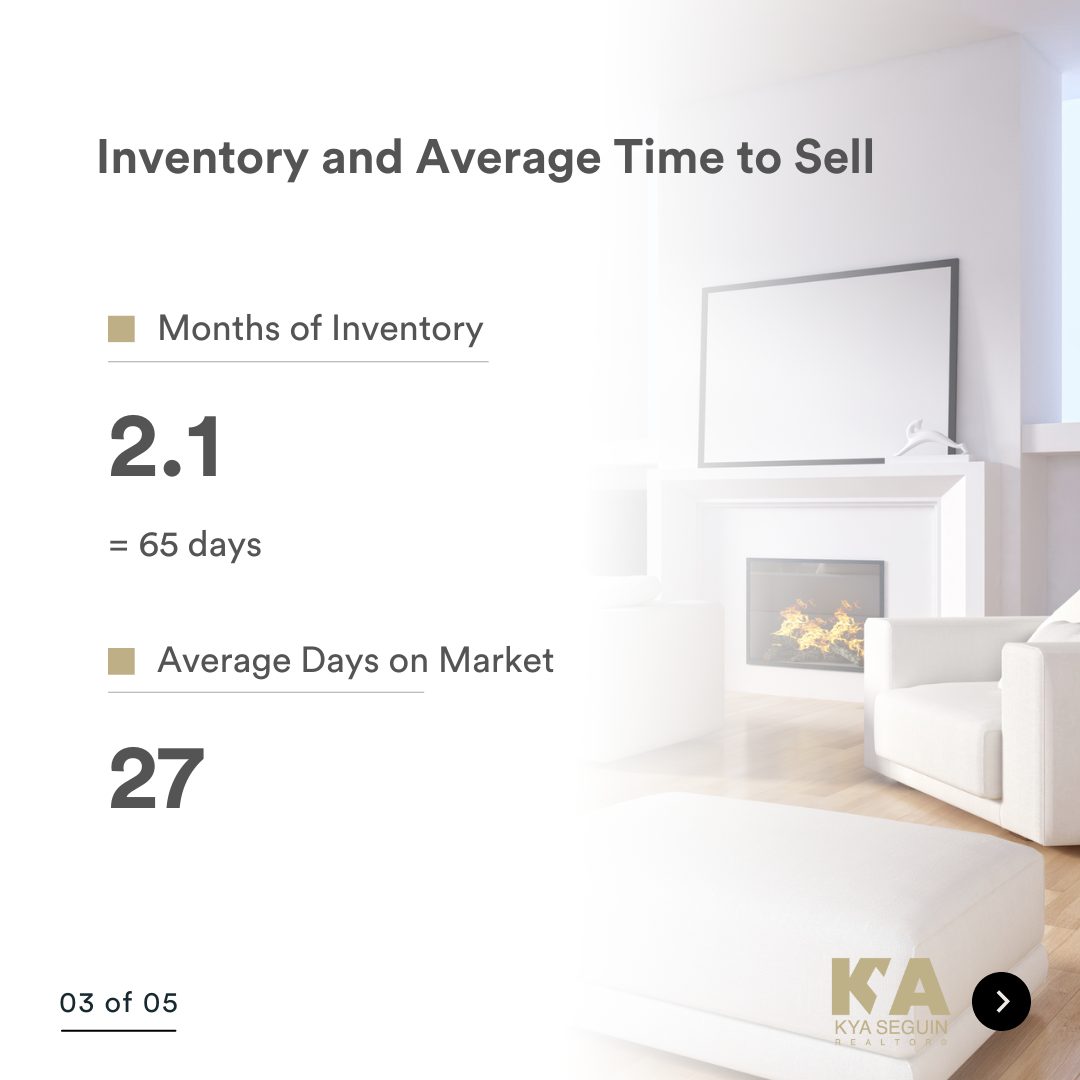
– Inventory levels continue to be in favour of Sellers, however, there is a shift in the market, with 2.18 months of inventory in the City of Peterborough (that means it would take 65 days to completely sell the homes that are currently listed for sale in the city, based on the the current rate of sales activity)
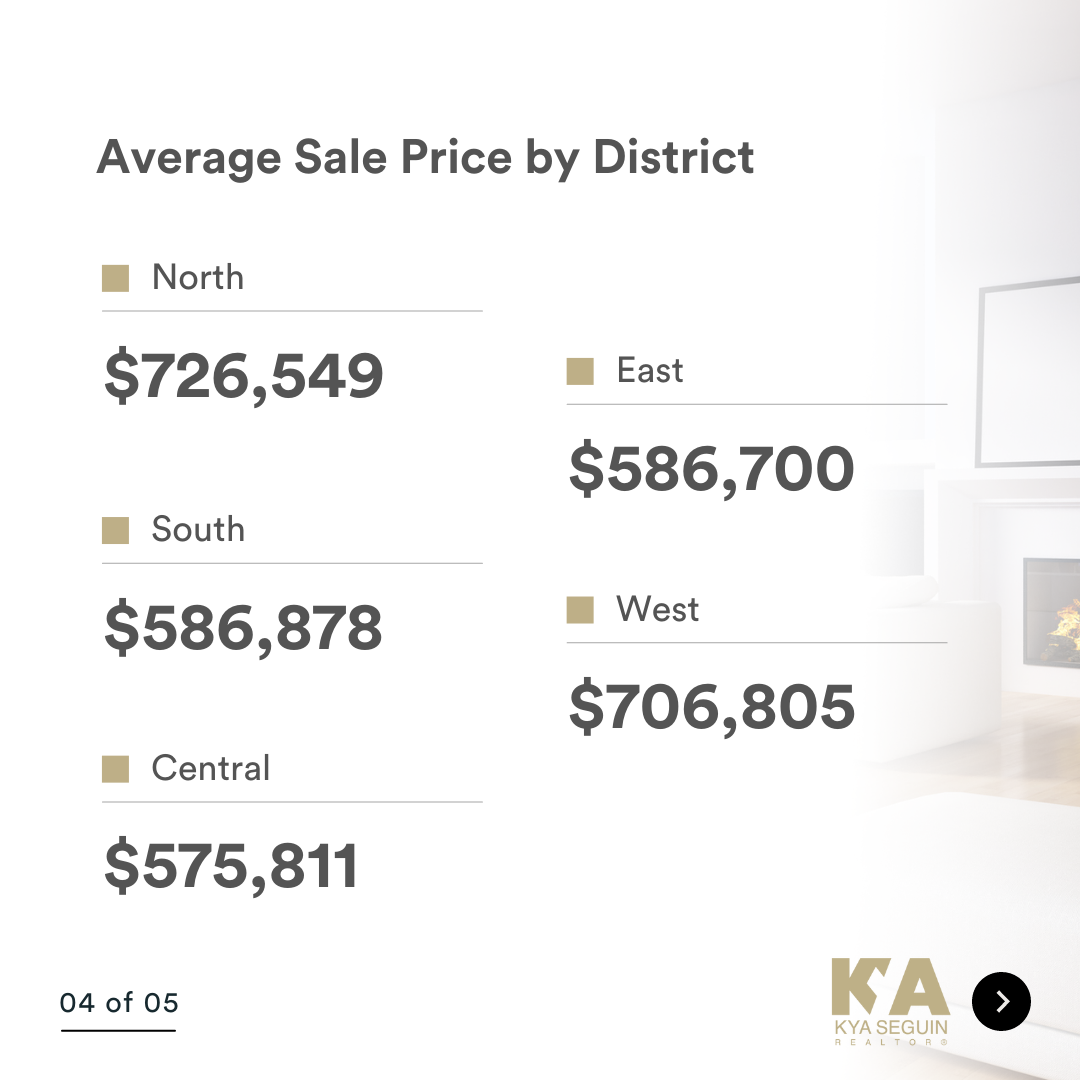
– Houses in the West end of Peterborough are selling the most – with 29 sales last month

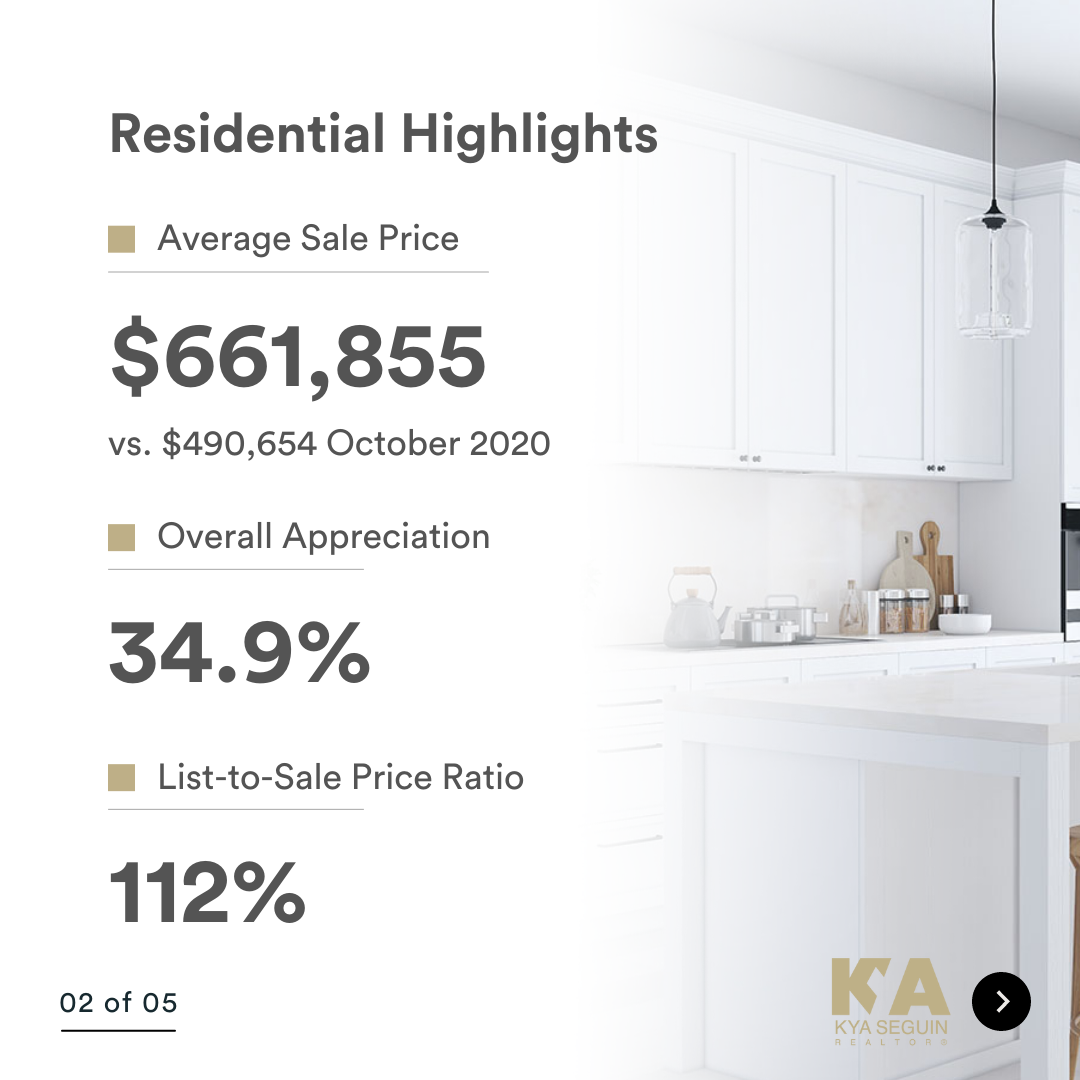
October 2021 Update

DID YOU KNOW?
– The average sale price is up 35% from this time last year
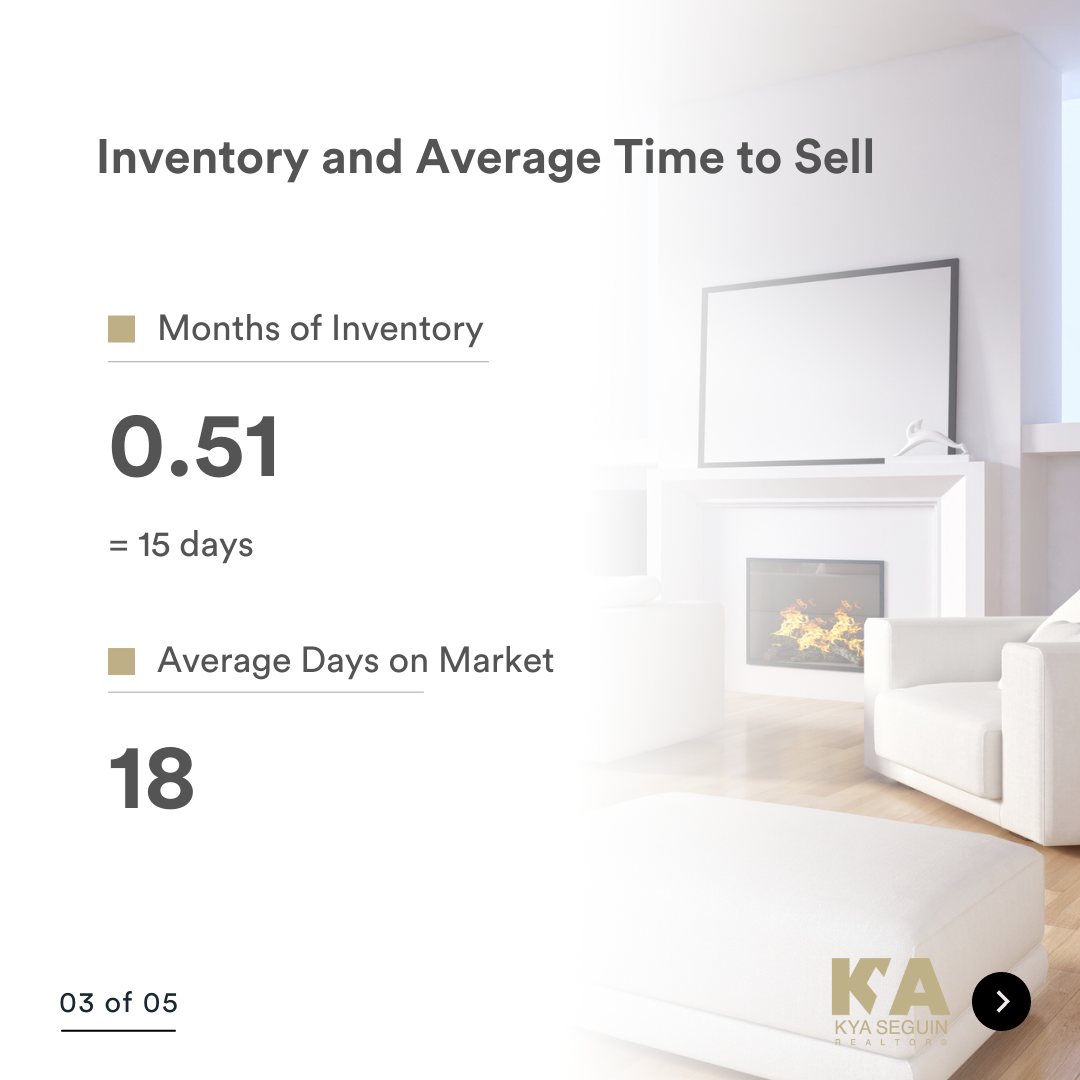
– Inventory levels continue to be in favour of Sellers, with 0.5 months of inventory in the City of Peterborough (that means it would take 15 days to completely sell the homes that are currently listed for sale in the city, based on the the current rate of sales activity)
– Houses in the West end of Peterborough are selling the most – with 29 sales last month
– Interest rates are starting to go up, it’s a good time to talk to a mortgage broker and lock in a rate now
Take a look at the market snapshot for October 2021, and reach out if you have any questions. Whether you are buying, selling, or just daydreaming about a new home, I can help you make an informed decision.