Facebook
 X
X
 Pinterest
 Copy Link
Peterborough Real Estate Stats •
December 15, 2023
November 2023 Update

DID YOU KNOW?
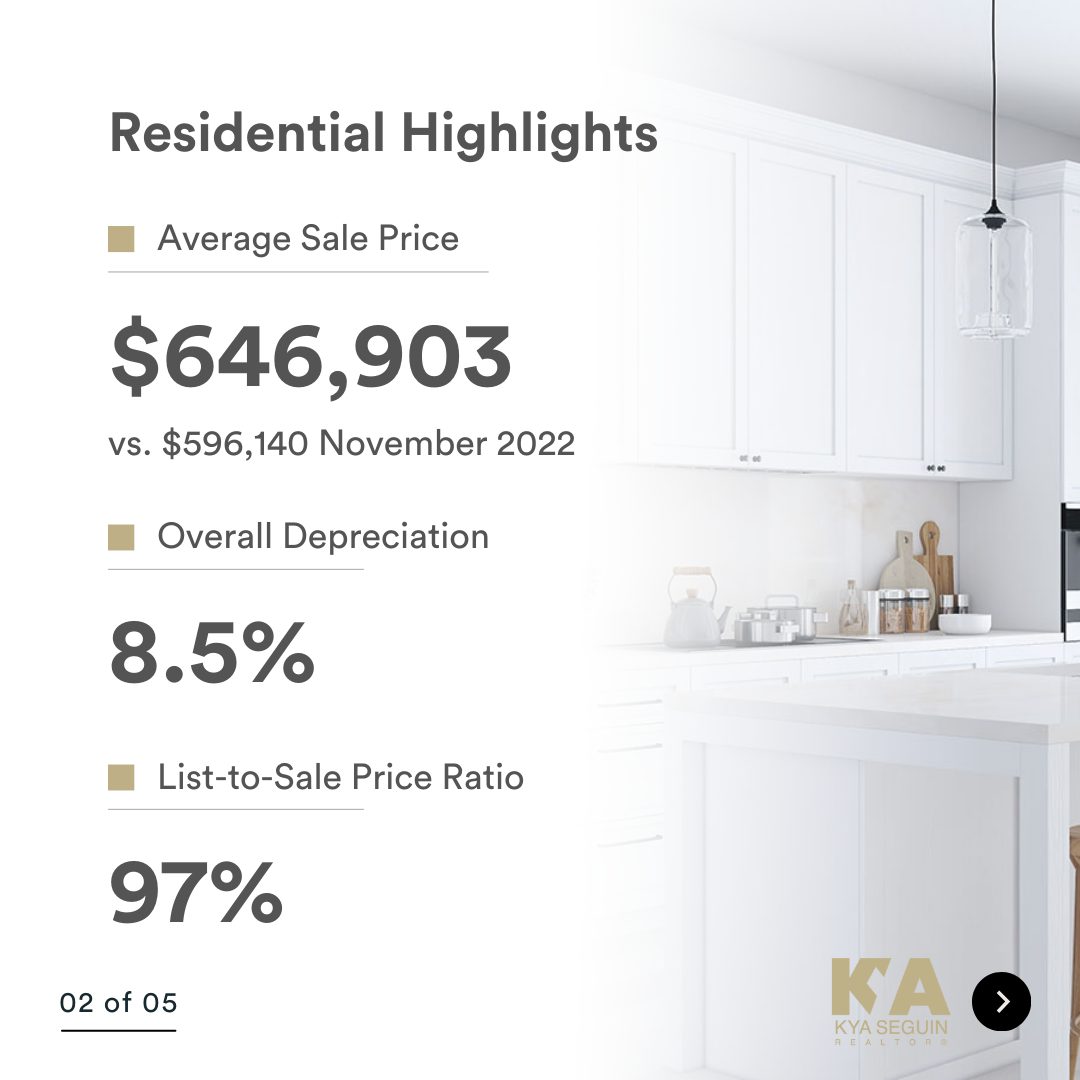
- The average sale price is UP 8.5% from this time last year
-
Inventory levels are closing in on a balanced market, with 3.2 months of inventory in the City of Peterborough (that means it would take 96 days to completely sell the homes that are currently listed for sale in the city, based on the the current rate of sales activity)
-
Home price appreciation is returning to normal seasonality
-
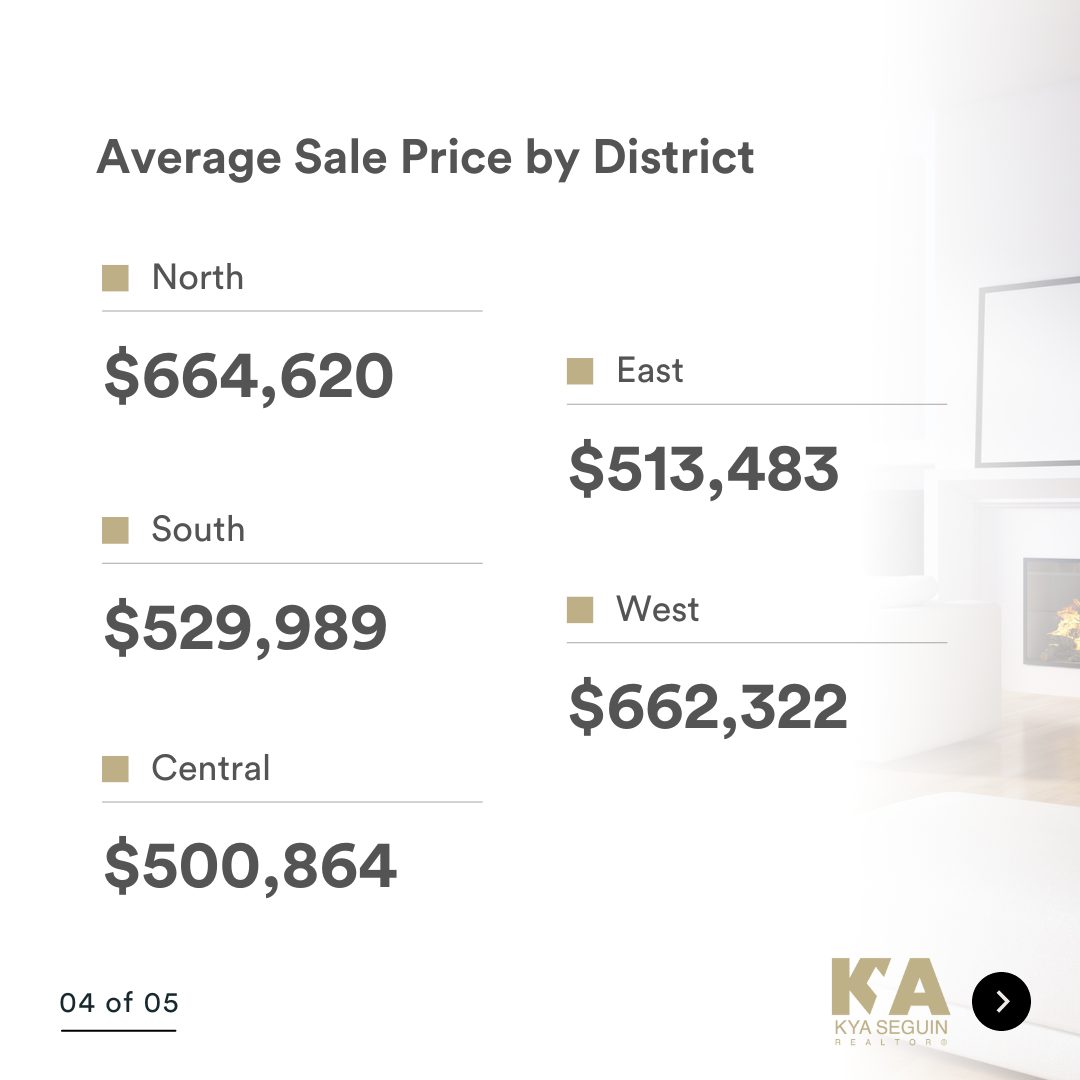
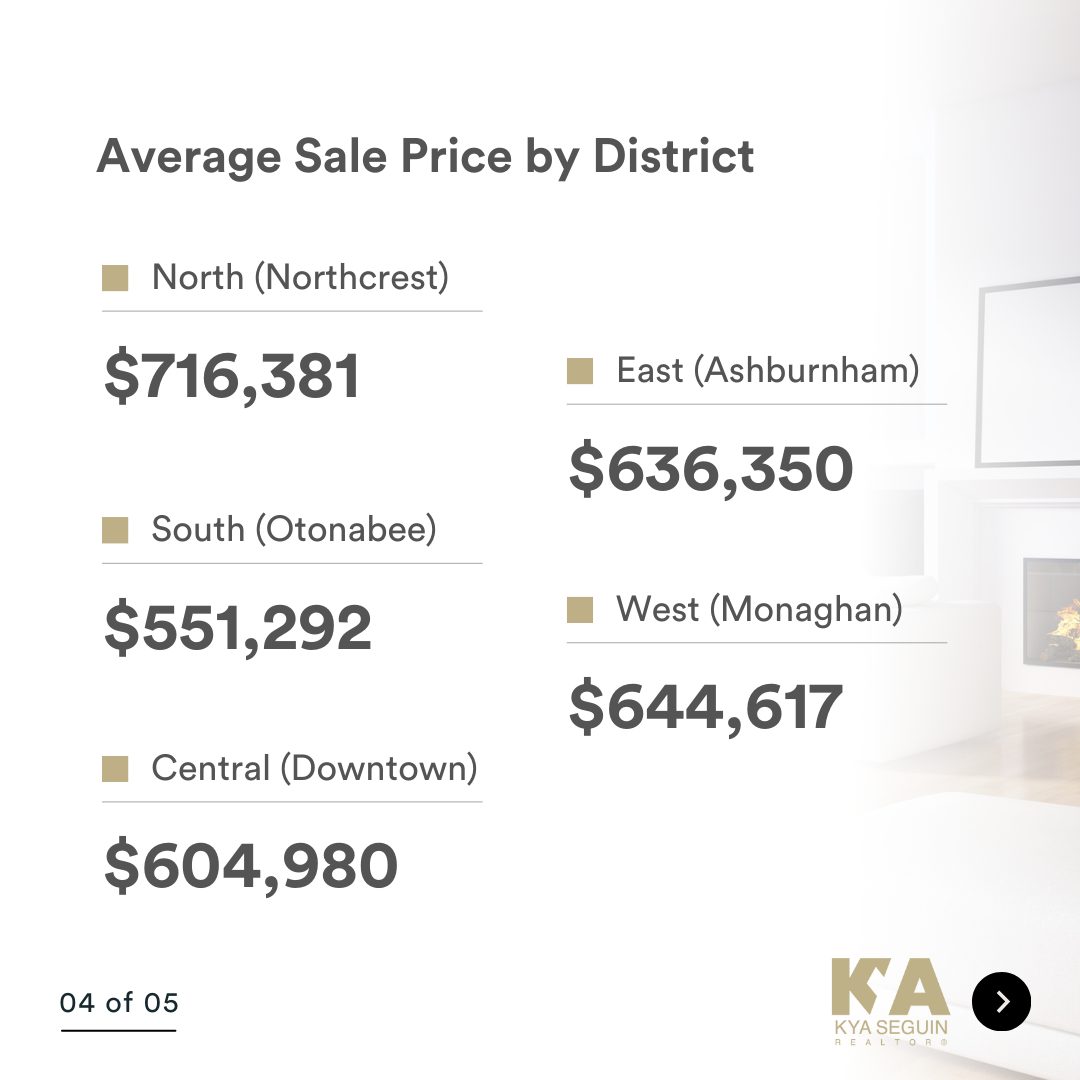
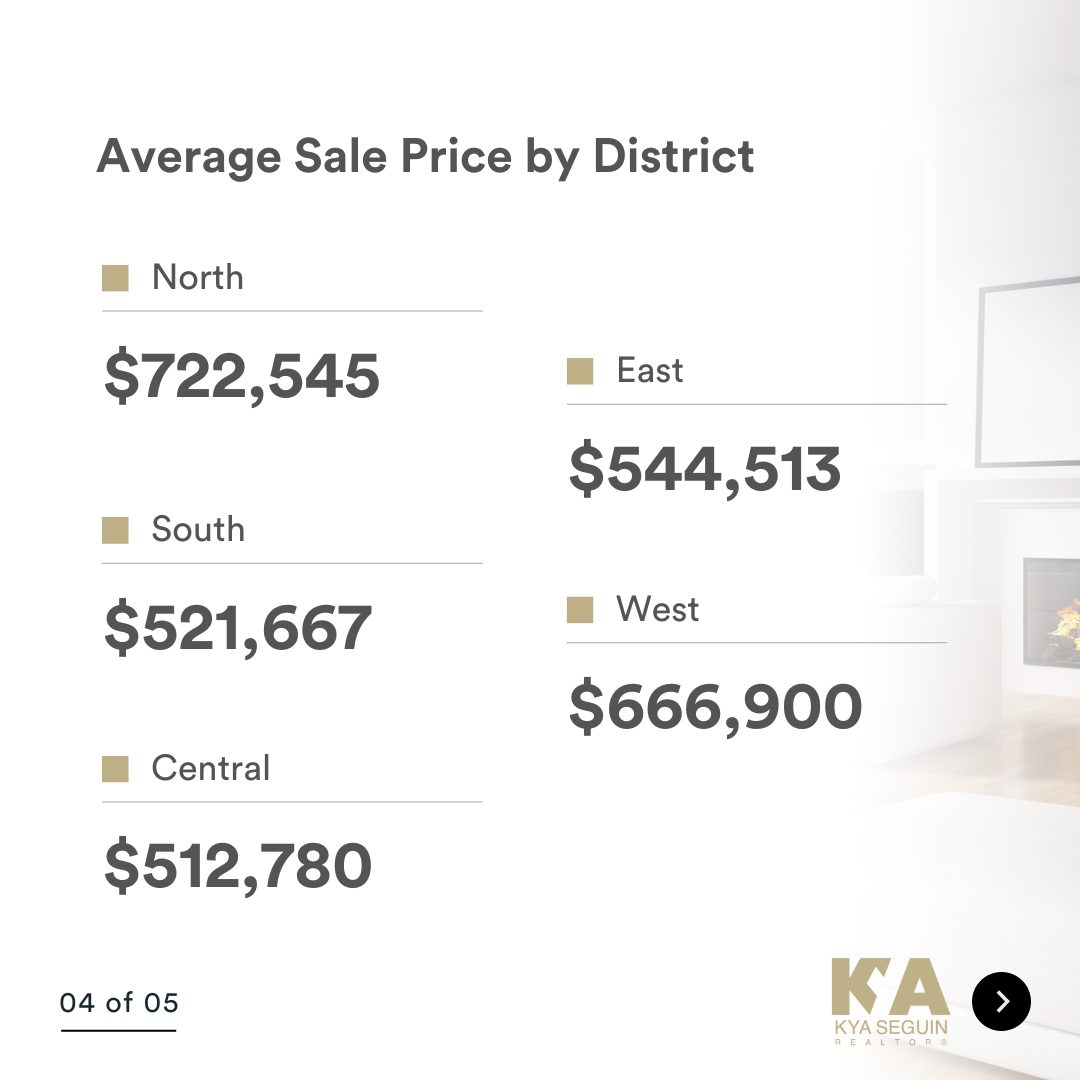
Houses in the West end of Peterborough are selling the most – with 15 sales last month
** Important to Note:
- When months of inventory goes up, prices come down, and when months of inventory goes down, prices go up (the law of supply and demand)
- A seller’s market = 4 months of inventory or less and a balanced market = 4-6 months of inventory.
Take a look at the market snapshot for November 2023, and reach out if you have any questions. Whether you are buying, selling, investing or just daydreaming about a new home, I can help you make an informed decision.
![]() Cover photo credit: Brian Parypa
Cover photo credit: Brian Parypa


Peterborough Real Estate Stats •
November 15, 2023
October 2023 Update

DID YOU KNOW?
- The average sale price is DOWN 9.8% from this time last year
- Although I am mentioning “depreciation”, what we’re really seeing is deceleration of appreciation (this is when prices continue to appreciate, but at a slower pace)
- Inventory levels are closing in on a balanced market, with 3.7 months of inventory in the City of Peterborough (that means it would take 111 days to completely sell the homes that are currently listed for sale in the city, based on the the current rate of sales activity)
- Home price appreciation is returning to normal seasonality
** Important to Note:
- When months of inventory goes up, prices come down, and when months of inventory goes down, prices go up (the law of supply and demand)
- A seller’s market = 4 months of inventory or less and a balanced market = 4-6 months of inventory.
Take a look at the market snapshot for October 2023, and reach out if you have any questions. Whether you are buying, selling, investing or just daydreaming about a new home, I can help you make an informed decision.
![]() Cover photo credit: Brian Parypa
Cover photo credit: Brian Parypa


Peterborough Real Estate Stats •
October 20, 2023
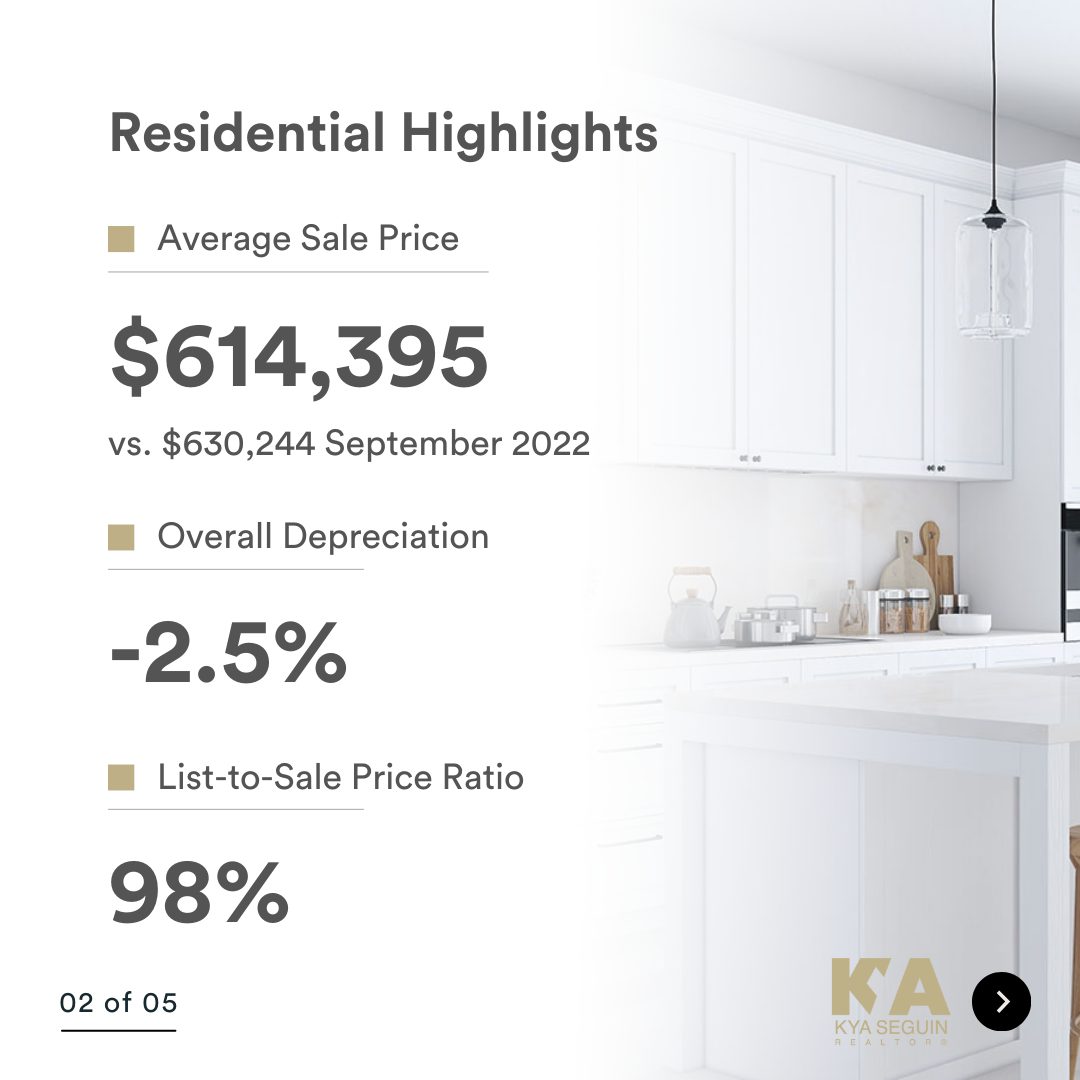
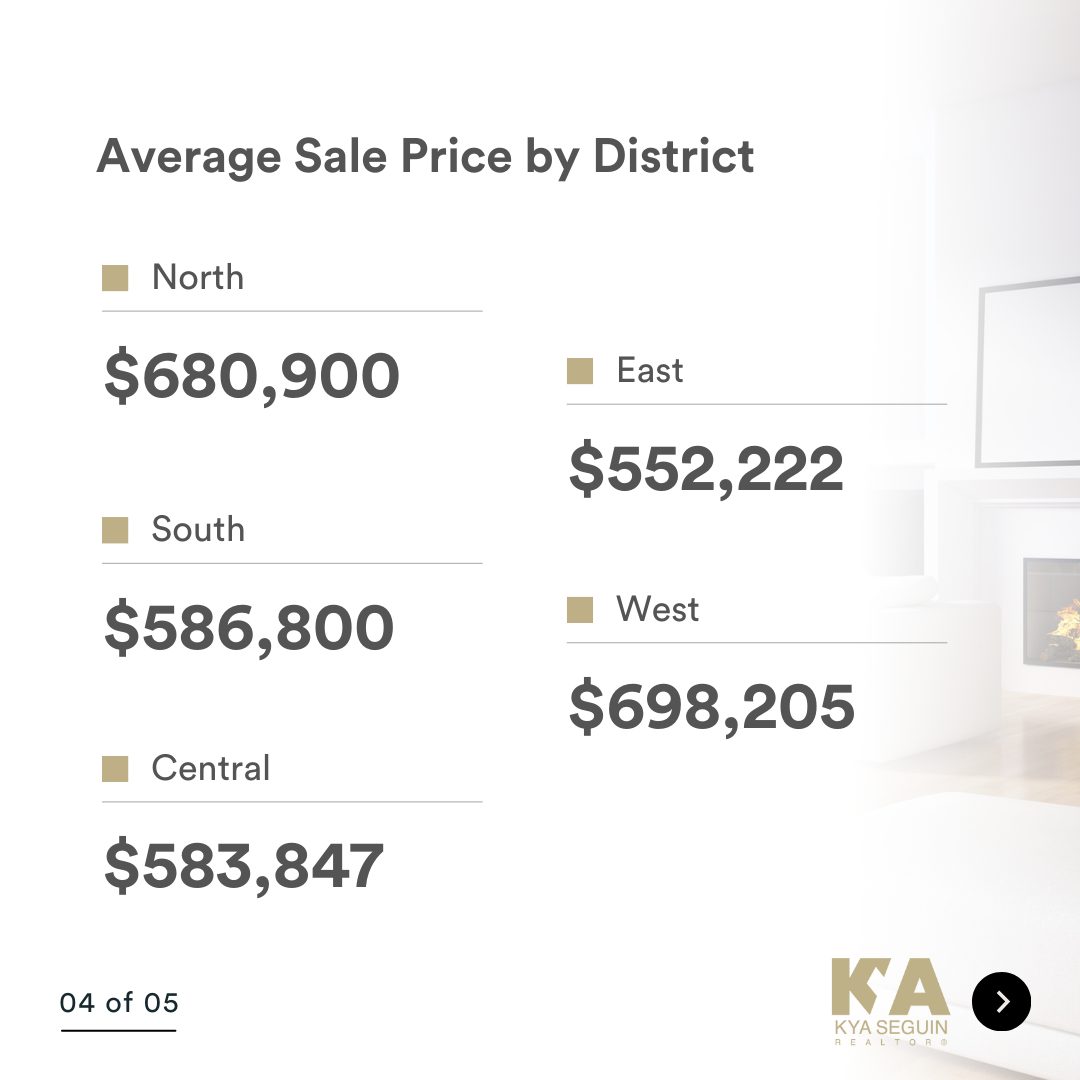
September 2023 Update

DID YOU KNOW?
- The average sale price is DOWN 2.5% from this time last year
- Inventory levels are in favour of Sellers, with 2.3 months of inventory in the City of Peterborough (that means it would take 69 days to completely sell the homes that are currently listed for sale in the city, based on the the current rate of sales activity)
- Houses in the West end of Peterborough are selling the most – with 27 sales last month
** Important to Note:
- When months of inventory goes up, prices come down, and when months of inventory goes down, prices go up (the law of supply and demand)
- A seller’s market = 4 months of inventory or less and a balanced market = 4-6 months of inventory.
Take a look at the market snapshot for September 2023, and reach out if you have any questions. Whether you are buying, selling, investing or just daydreaming about a new home, I can help you make an informed decision.
![]() Cover photo credit: Brian Parypa
Cover photo credit: Brian Parypa


Peterborough Real Estate Stats •
August 21, 2023
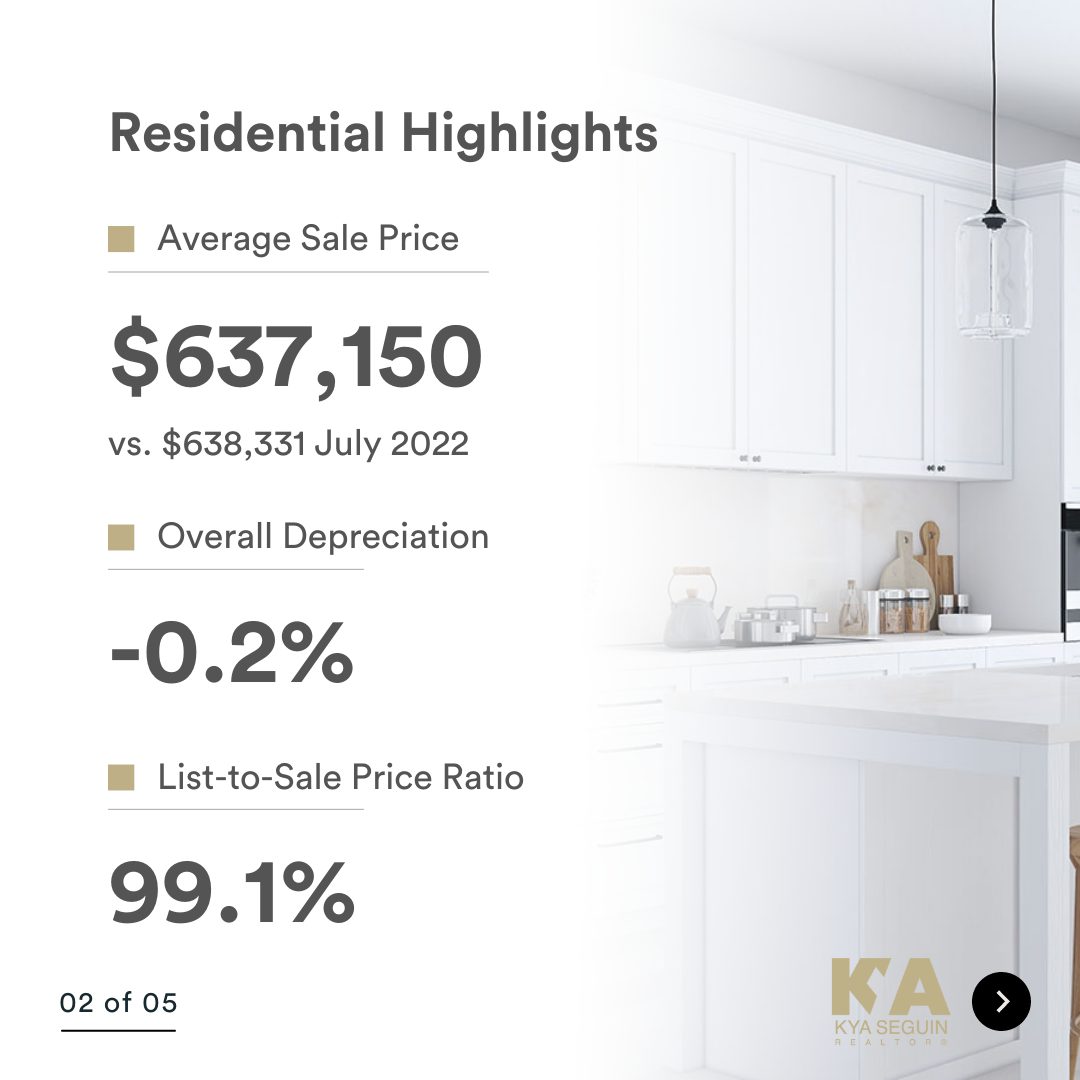
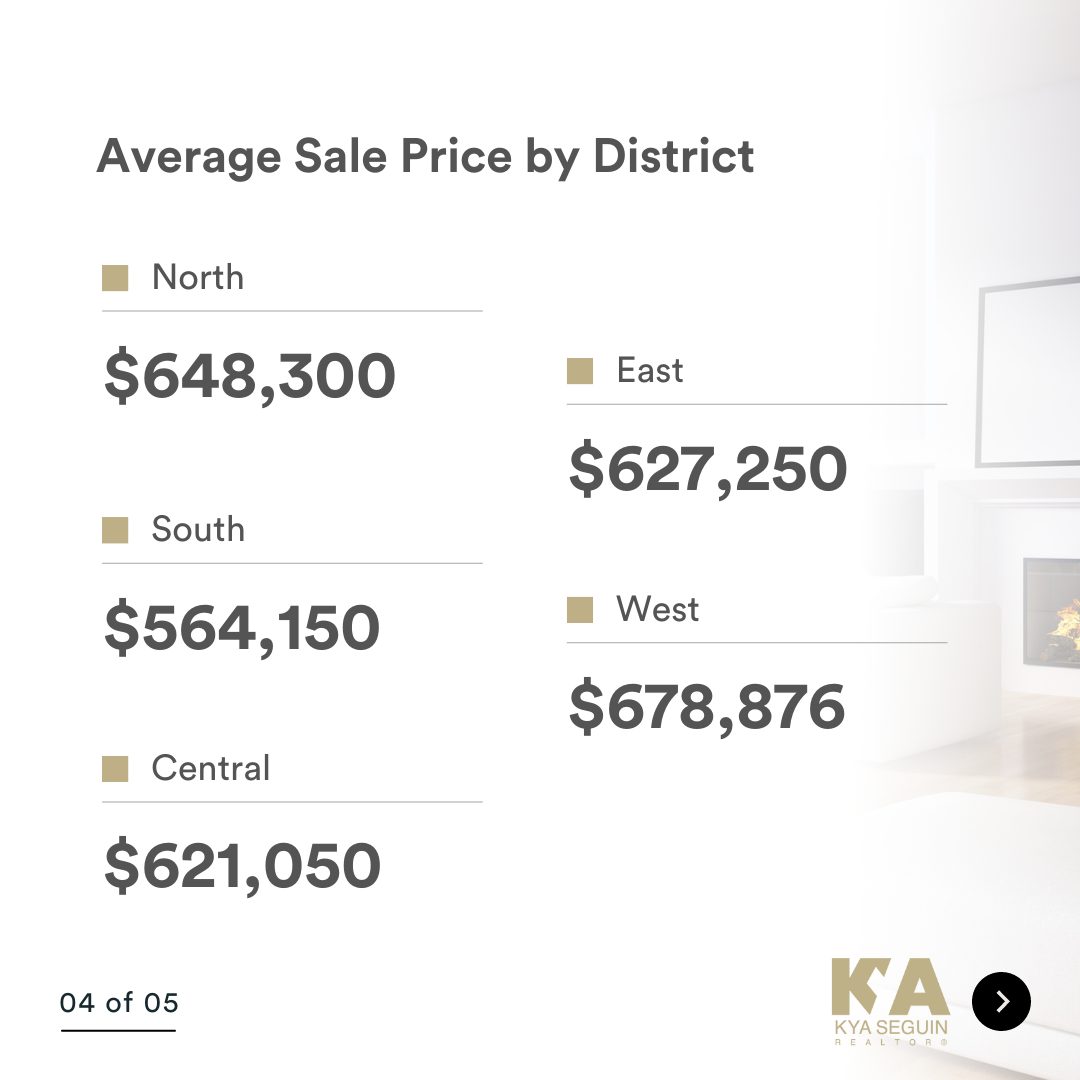
July 2023 Update

DID YOU KNOW?
- The average sale price is DOWN 0.2% from this time last year
- Inventory levels have slowed down (which is typical for July / summer), with 2.7 months of inventory in the City of Peterborough (that means it would take 81 days to completely sell the homes that are currently listed for sale in the city, based on the the current rate of sales activity)
- Houses in the North end of Peterborough are selling the most – with 18 sales last month
** Important to Note:
- When months of inventory goes up, prices come down, and when months of inventory goes down, prices go up (the law of supply and demand)
- A seller’s market = 4 months of inventory or less and a balanced market = 4-6 months of inventory.
Take a look at the market snapshot for July 2023, and reach out if you have any questions. Whether you are buying, selling, investing or just daydreaming about a new home, I can help you make an informed decision.
![]() Cover photo credit: Brian Parypa
Cover photo credit: Brian Parypa

Peterborough Real Estate Stats •
July 19, 2023
June 2023 Update

DID YOU KNOW?
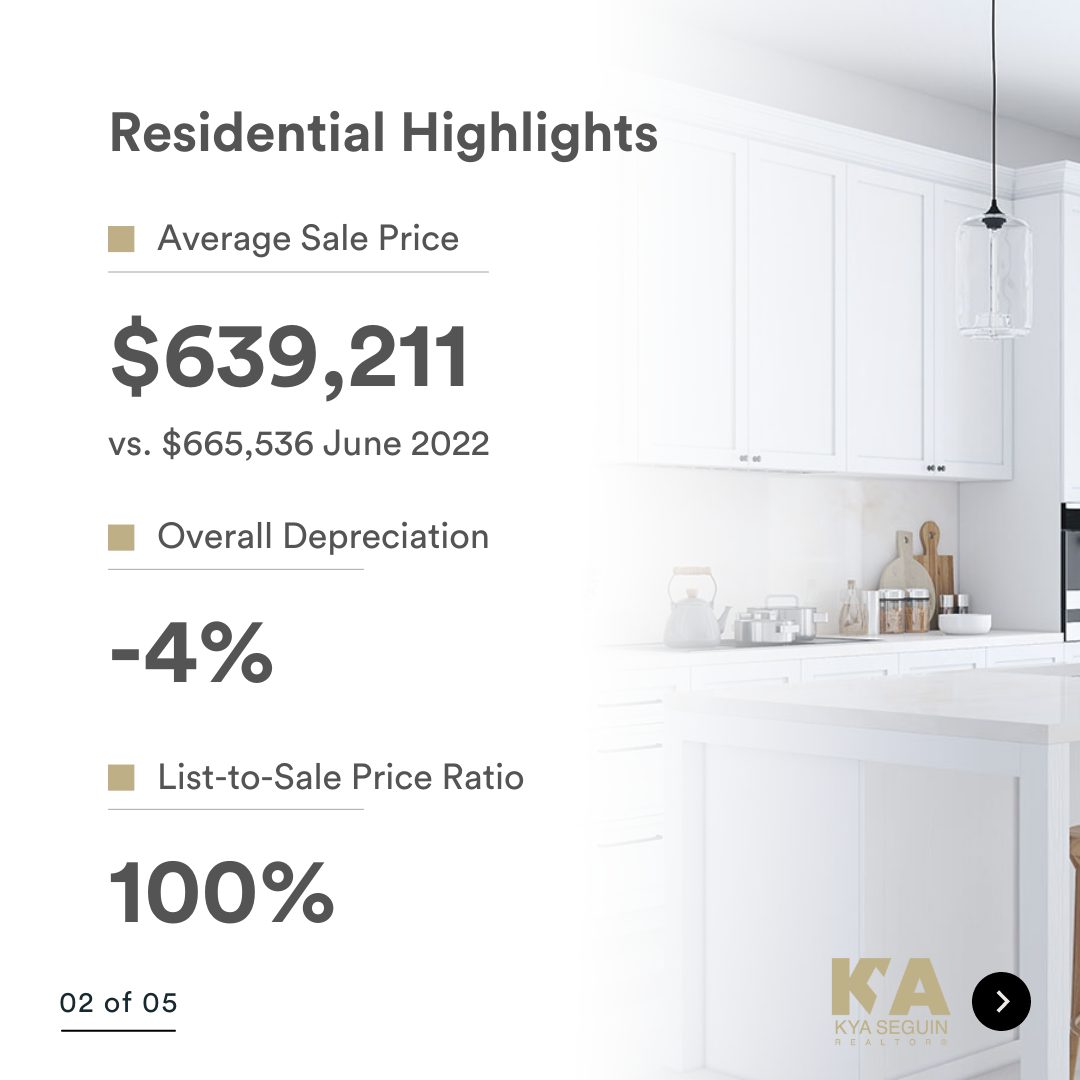
- The average sale price is DOWN 4% from this time last year
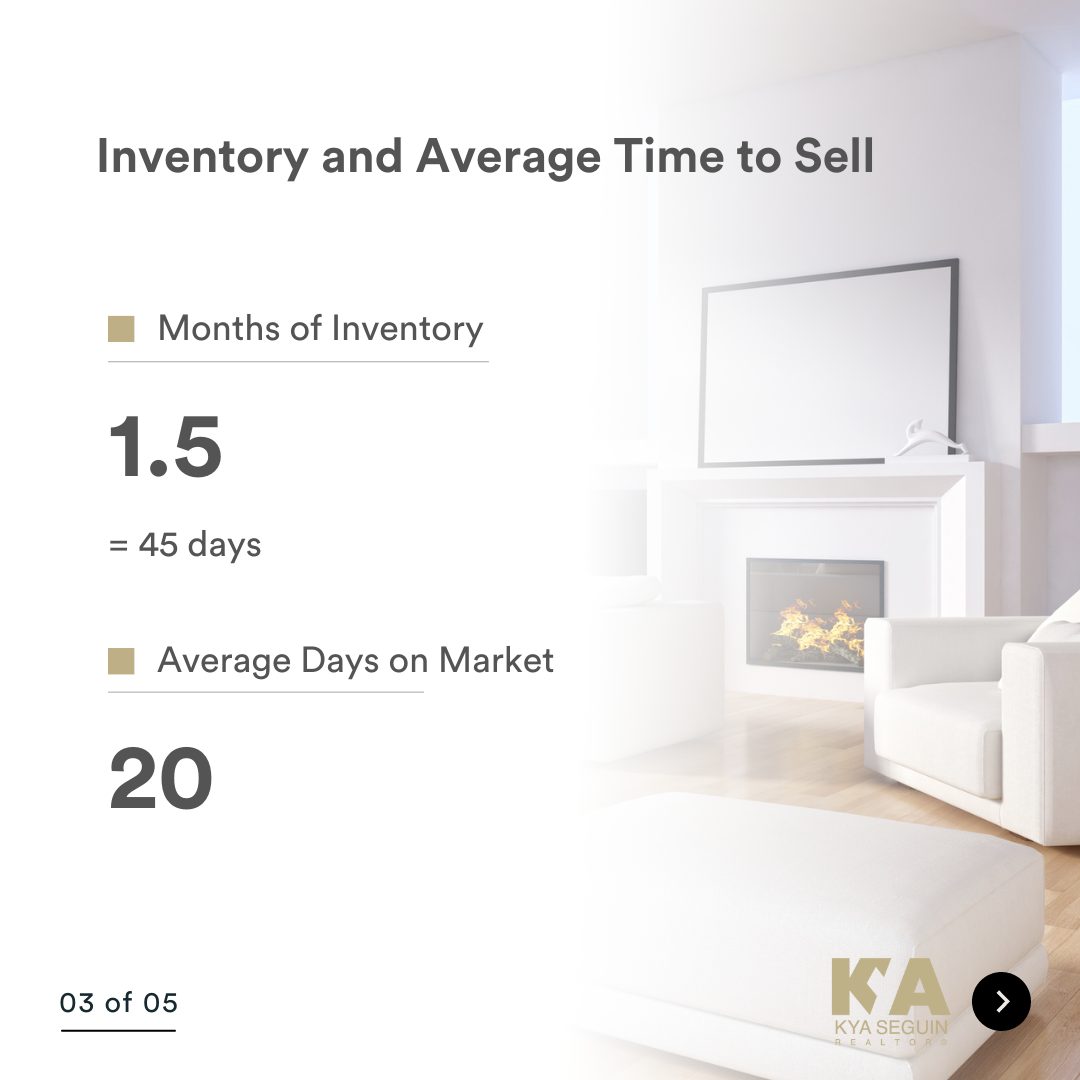
- Inventory levels continue to be in favour of Sellers, with 1.5 months of inventory in the City of Peterborough (that means it would take 45 days to completely sell the homes that are currently listed for sale in the city, based on the the current rate of sales activity)
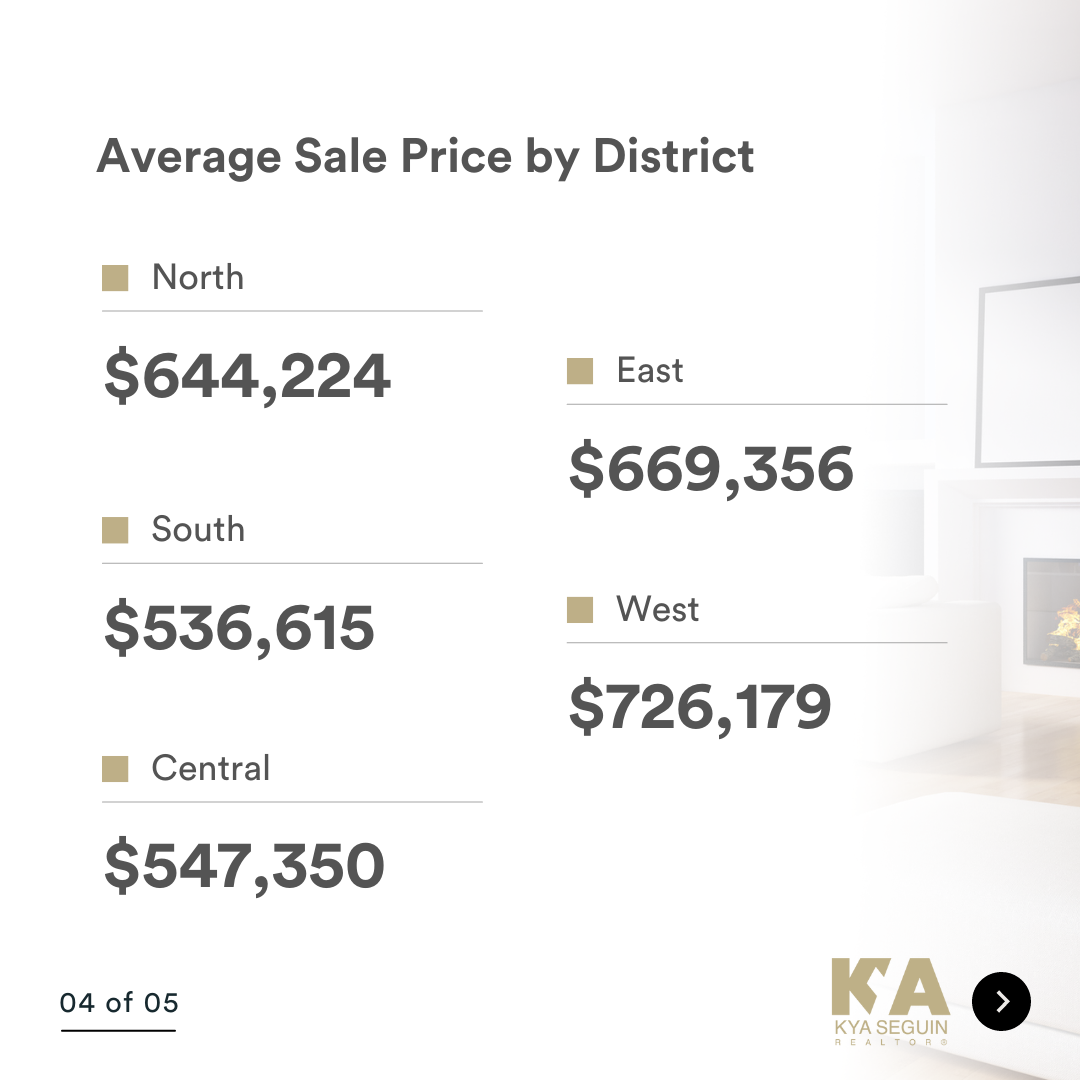
- Houses in the West end of Peterborough are selling the most – with 42 sales last month
** Important to Note:
- When months of inventory goes up, prices come down, and when months of inventory goes down, prices go up (the law of supply and demand)
- A seller’s market = 4 months of inventory or less and a balanced market = 4-6 months of inventory.
Take a look at the market snapshot for June 2023, and reach out if you have any questions. Whether you are buying, selling, investing or just daydreaming about a new home, I can help you make an informed decision.
![]() Cover photo credit: Brian Parypa
Cover photo credit: Brian Parypa
Peterborough Real Estate Stats •
June 19, 2023
May 2023 Update

DID YOU KNOW?
- The average sale price is DOWN 10.8% from this time last year
- Inventory levels continue to be in favour of Sellers, with 1.6 months of inventory in the City of Peterborough (that means it would take 48 days to completely sell the homes that are currently listed for sale in the city, based on the the current rate of sales activity)
- Houses in the West end of Peterborough are selling the most – with 39 sales last month
** Important to Note:
- When months of inventory goes up, prices come down, and when months of inventory goes down, prices go up (the law of supply and demand)
- A seller’s market = 4 months of inventory or less and a balanced market = 4-6 months of inventory.
Take a look at the market snapshot for May 2023, and reach out if you have any questions. Whether you are buying, selling, investing or just daydreaming about a new home, I can help you make an informed decision.
![]() Cover photo credit: Brian Parypa
Cover photo credit: Brian Parypa


Peterborough Real Estate Stats •
May 15, 2023
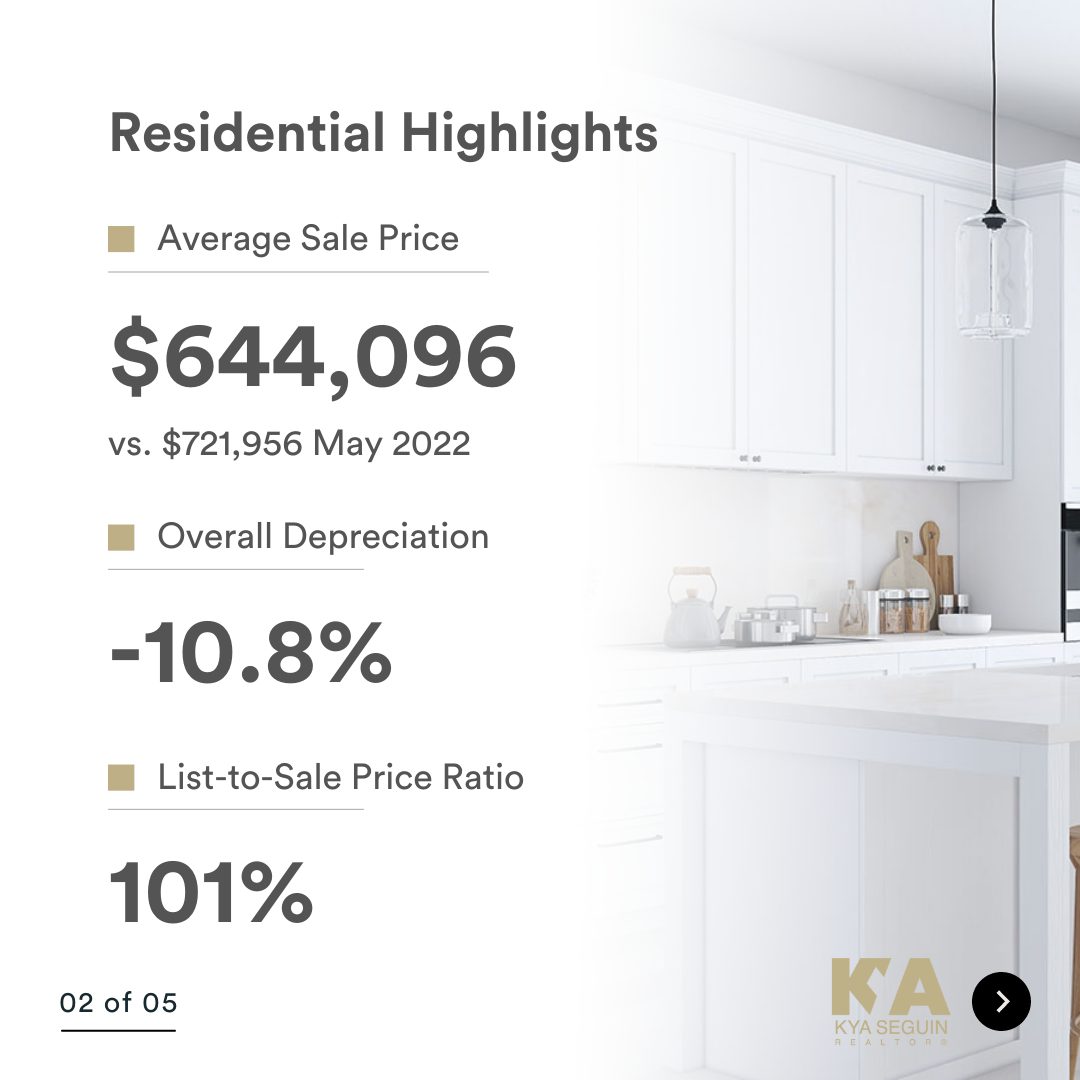
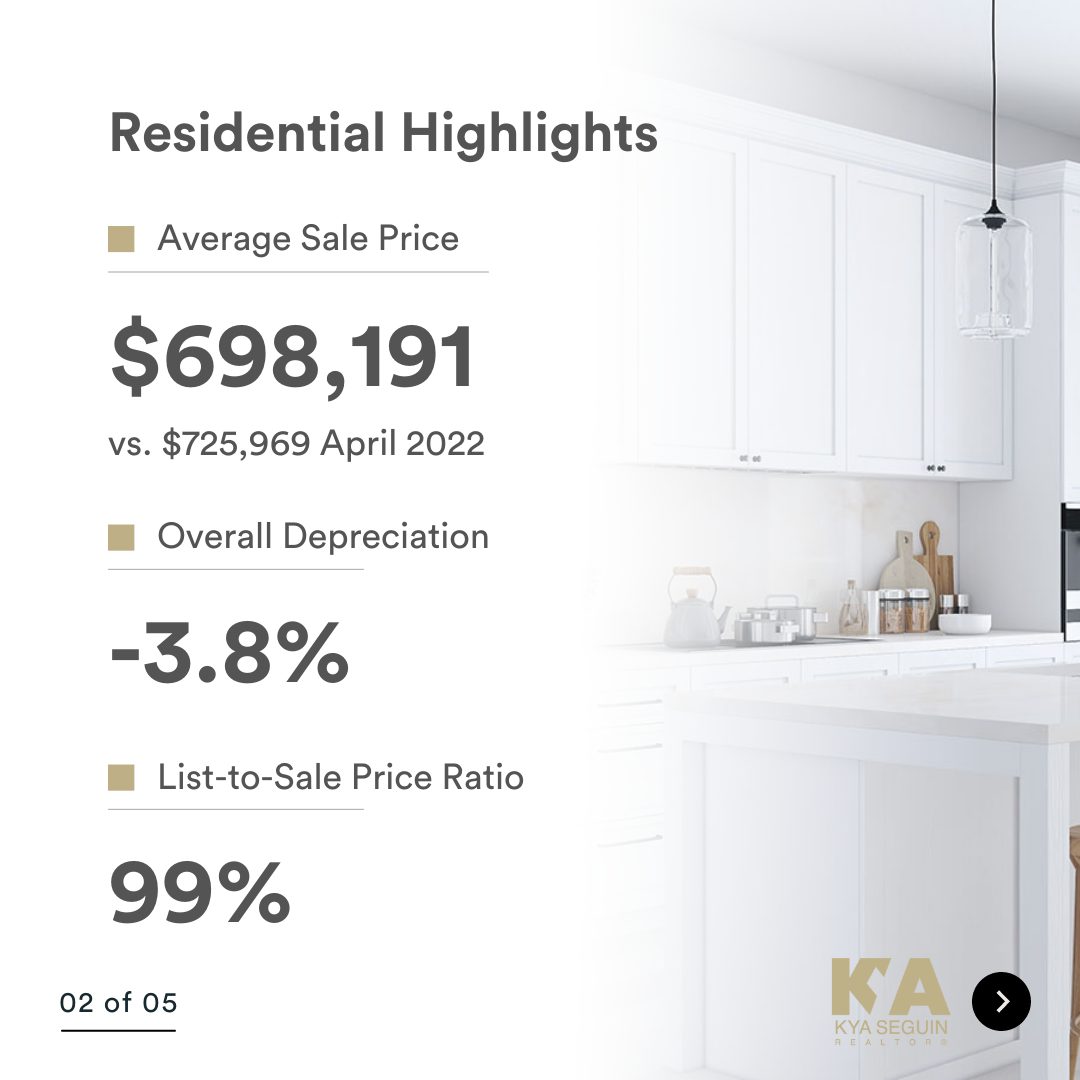
April 2023 Update

DID YOU KNOW?
- The average sale price is DOWN 3.8% from this time last year
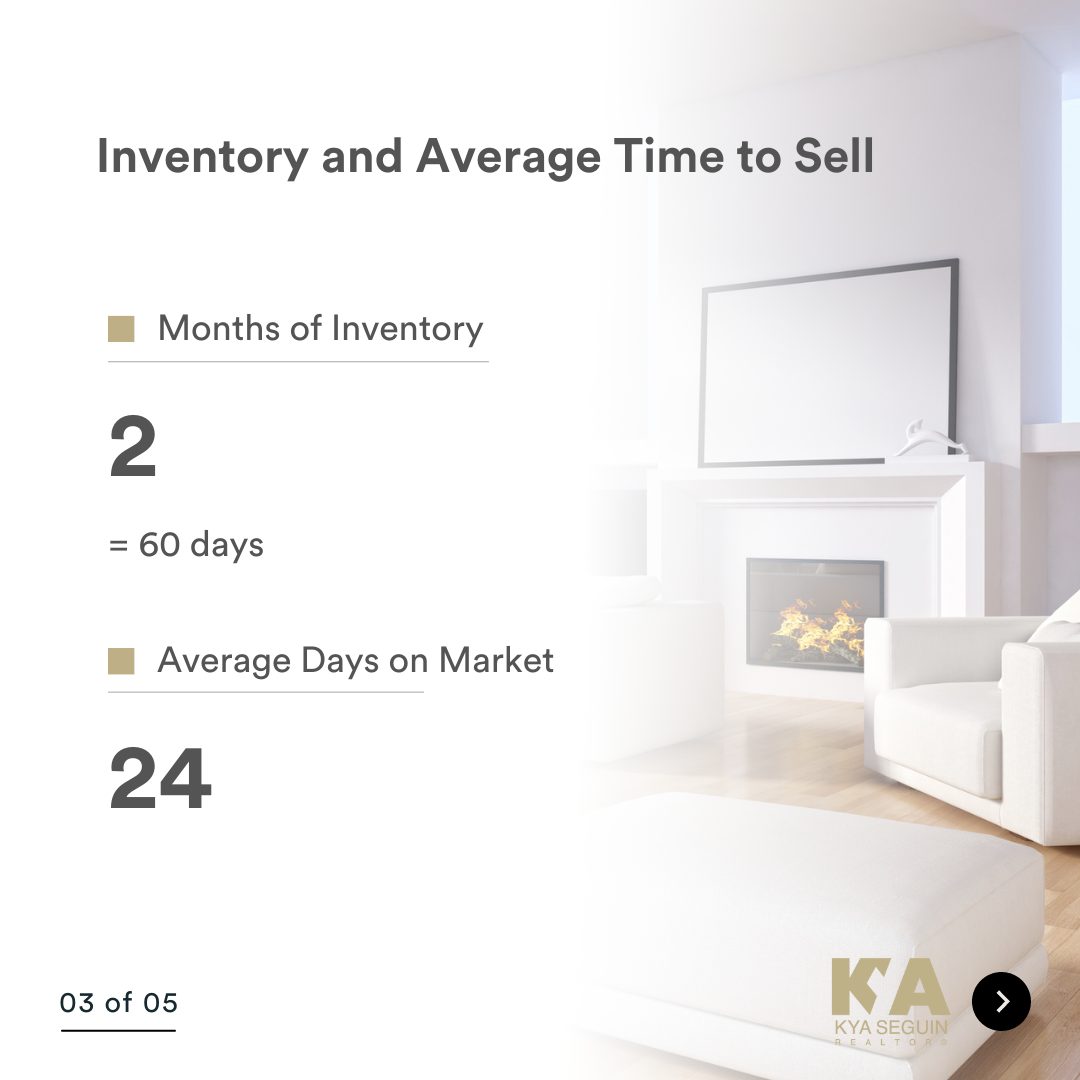
- Inventory levels continue to be in favour of Sellers, with 2 months of inventory in the City of Peterborough (that means it would take 60 days to completely sell the homes that are currently listed for sale in the city, based on the the current rate of sales activity)
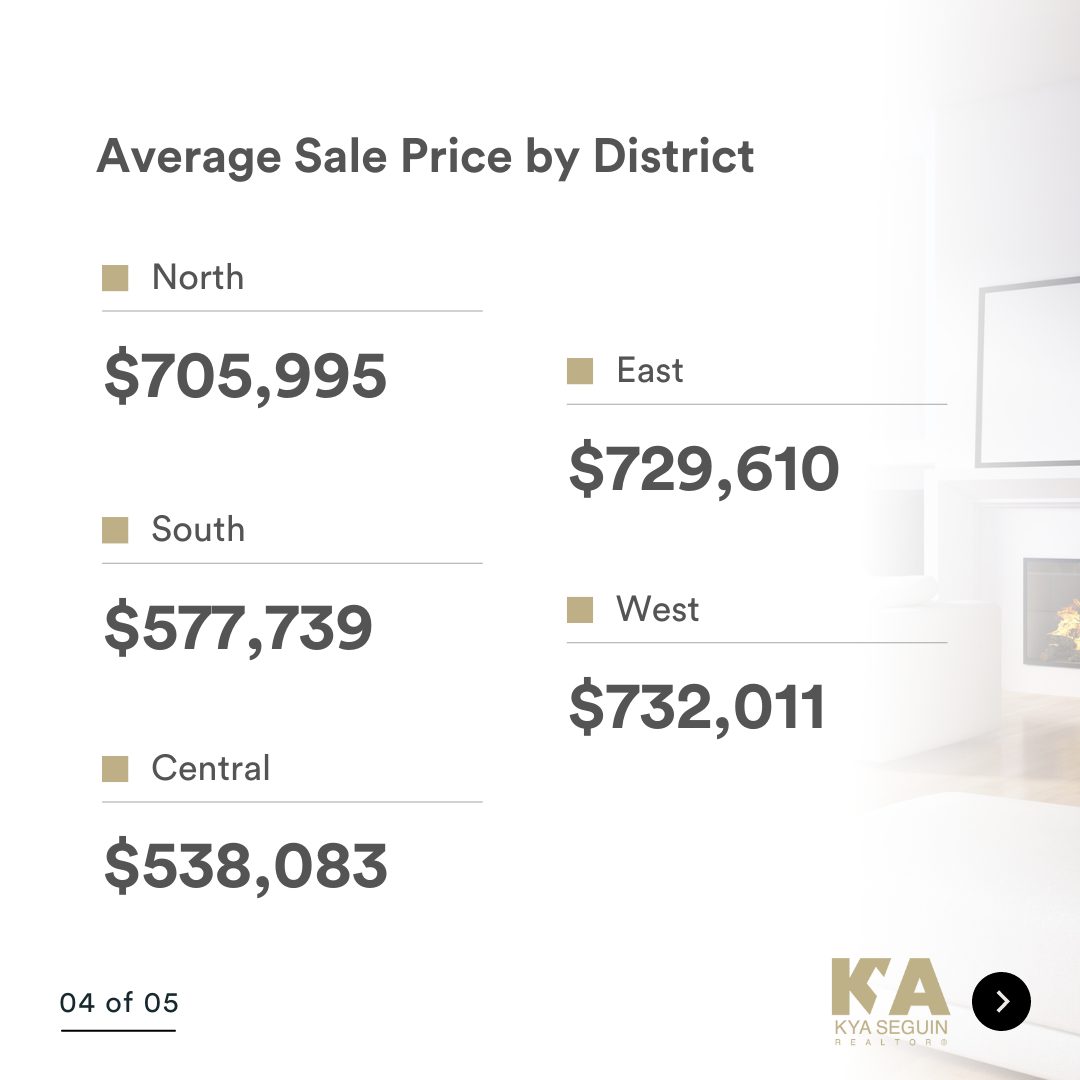
- Houses in the West end of Peterborough are selling the most – with 27 sales last month
** Important to Note:
- When months of inventory goes up, prices come down, and when months of inventory goes down, prices go up (the law of supply and demand)
- A seller’s market = 4 months of inventory or less and a balanced market = 4-6 months of inventory.
Take a look at the market snapshot for April 2023, and reach out if you have any questions. Whether you are buying, selling, investing or just daydreaming about a new home, I can help you make an informed decision.
![]() Cover photo credit: Brian Parypa
Cover photo credit: Brian Parypa
Peterborough Real Estate Stats •
April 18, 2023
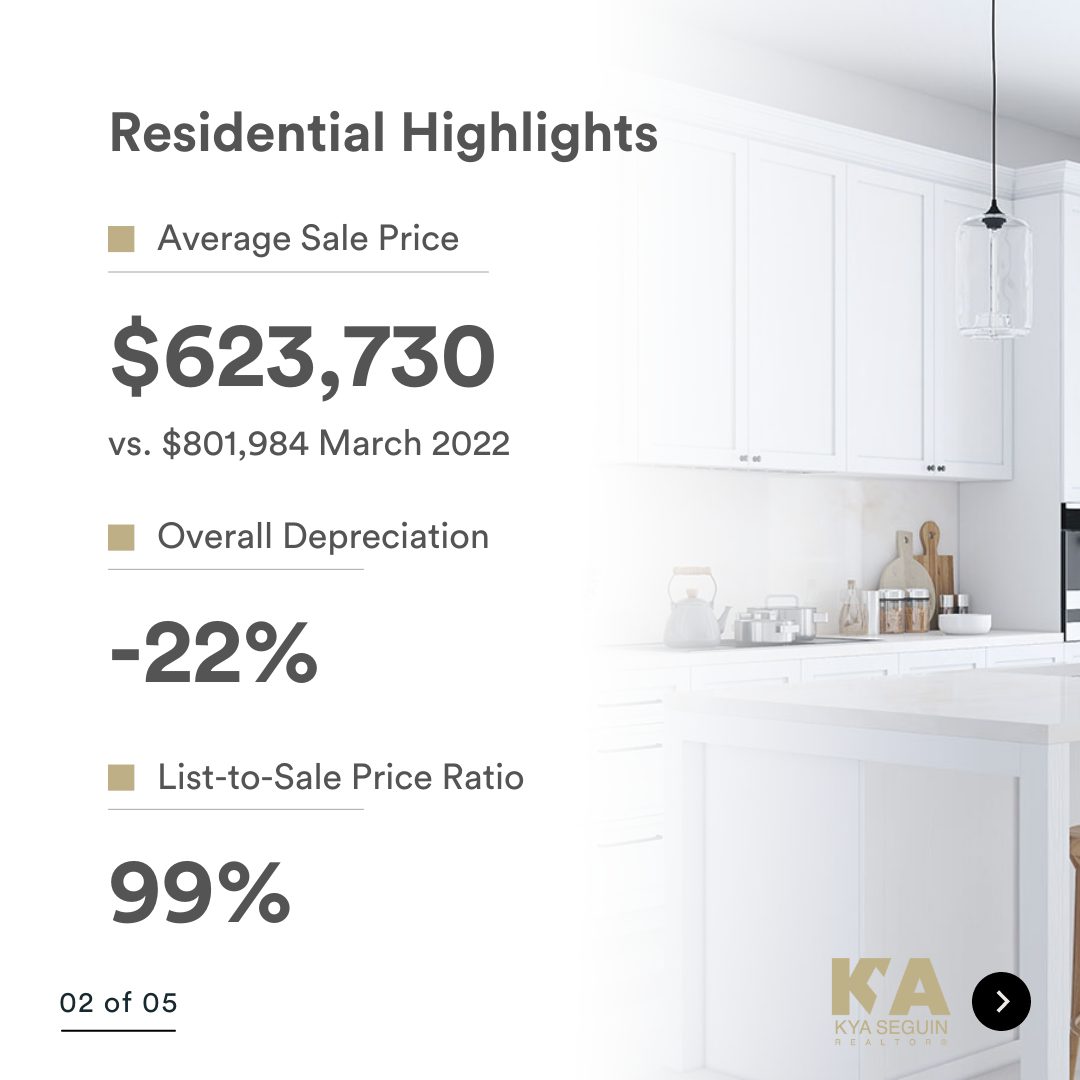
March 2023 Update

DID YOU KNOW?
- The average sale price is DOWN 22% from this time last year (keep in mind, February & March were the “peak” of the market last year)
- Inventory levels continue to be in favour of Sellers, with 1.8 months of inventory in the City of Peterborough (that means it would take 54 days to completely sell the homes that are currently listed for sale in the city, based on the the current rate of sales activity)
- Houses in the North end of Peterborough are selling the most – with 17 sales last month
** Important to Note:
- When months of inventory goes up, prices come down, and when months of inventory goes down, prices go up (the law of supply and demand)
- A seller’s market = 4 months of inventory or less and a balanced market = 4-6 months of inventory.
Take a look at the market snapshot for March 2023, and reach out if you have any questions. Whether you are buying, selling, investing or just daydreaming about a new home, I can help you make an informed decision.
![]() Cover photo credit: Brian Parypa
Cover photo credit: Brian Parypa


Peterborough Real Estate Stats •
March 14, 2023
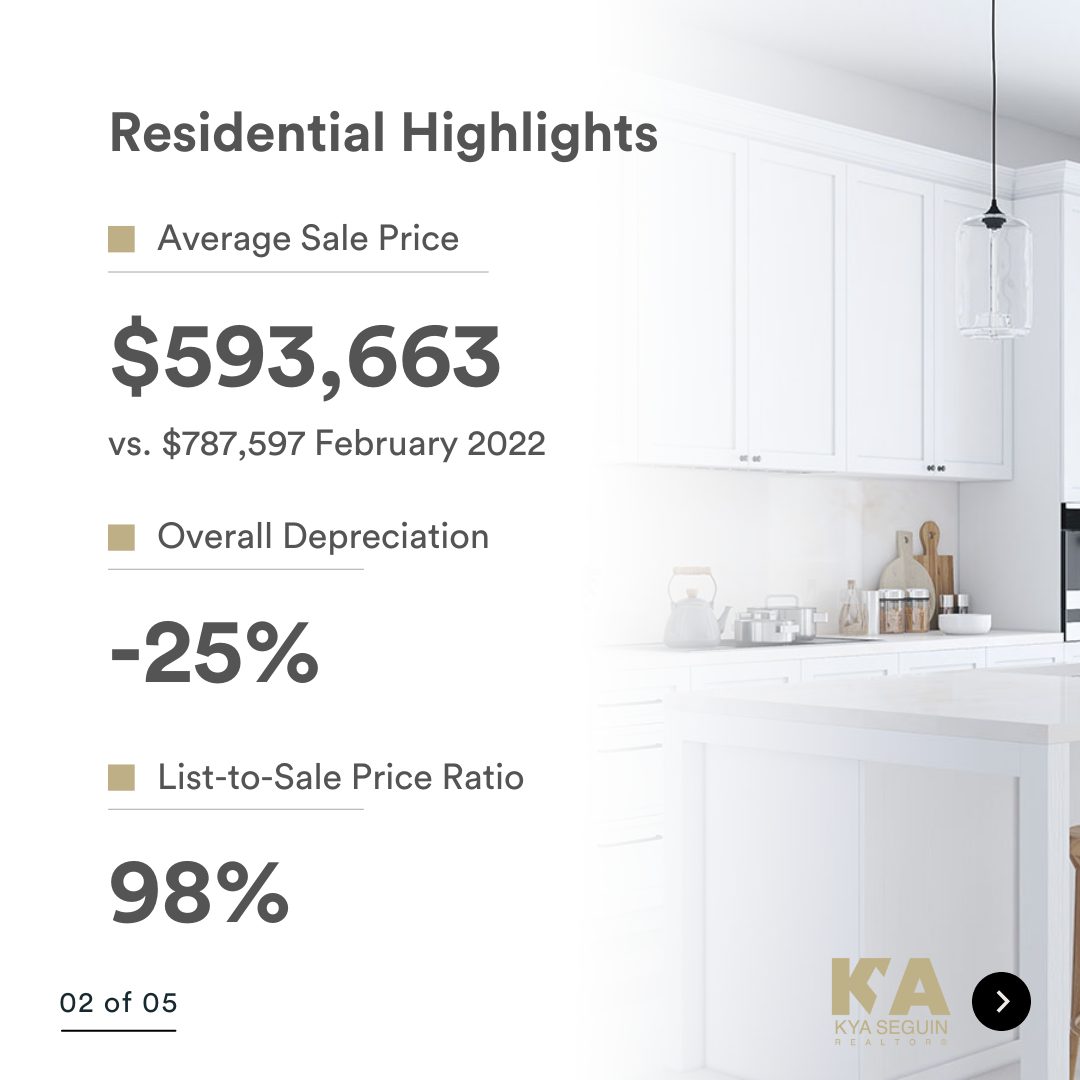
February 2023 Update

DID YOU KNOW?
- The average sale price is DOWN 25% from this time last year (keep in mind, February & March were the “peak” of the market last year)
- Inventory levels continue to be in favour of Sellers, with 2 months of inventory in the City of Peterborough (that means it would take 60 days to completely sell the homes that are currently listed for sale in the city, based on the the current rate of sales activity)
- Houses in the East end of Peterborough are selling the most – with 12 sales last month
** Important to Note:
- When months of inventory goes up, prices come down, and when months of inventory goes down, prices go up (the law of supply and demand)
- A seller’s market = 4 months of inventory or less and a balanced market = 4-6 months of inventory.
Take a look at the market snapshot for February 2023, and reach out if you have any questions. Whether you are buying, selling, investing or just daydreaming about a new home, I can help you make an informed decision.

Peterborough Real Estate Stats •
February 22, 2023
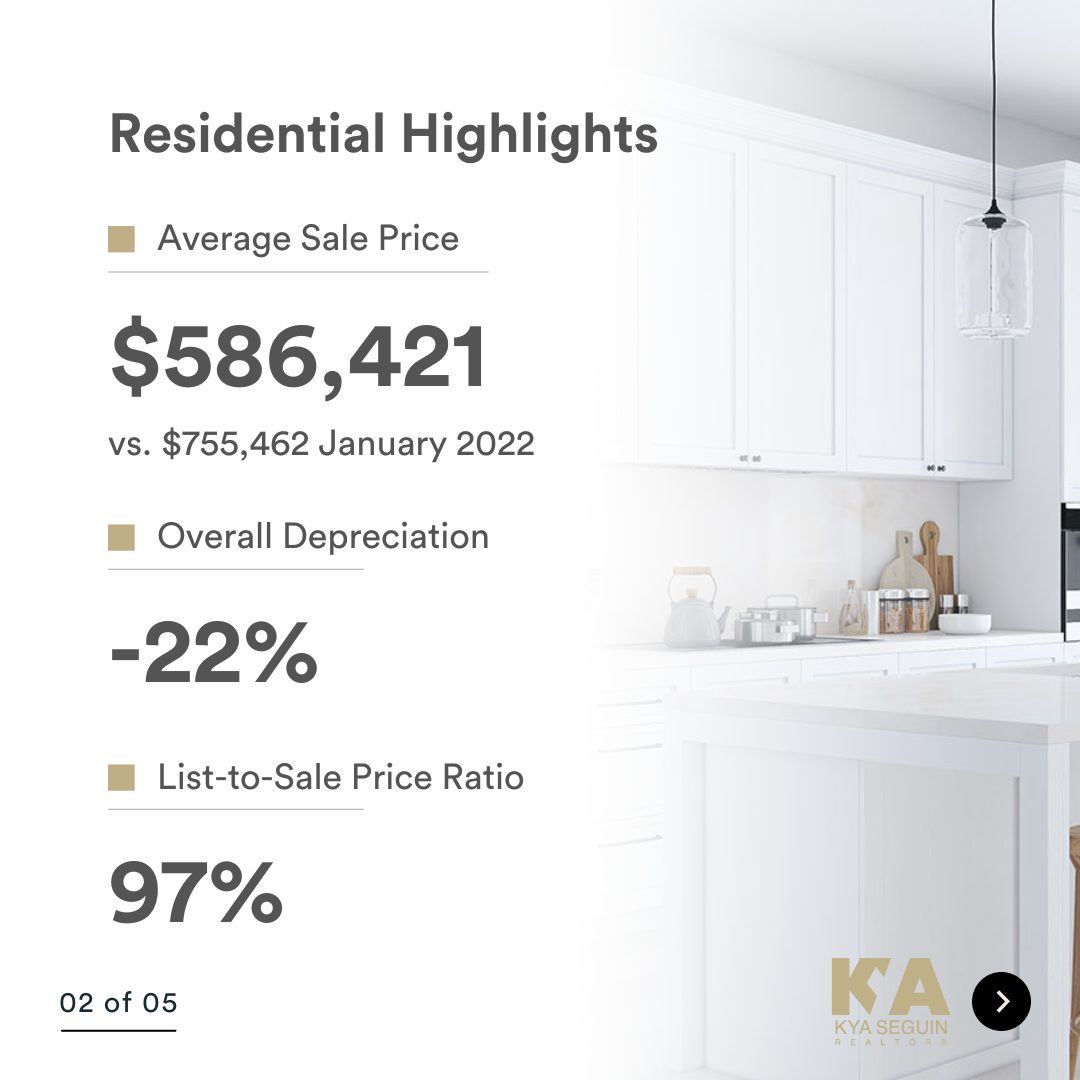
January 2023 Update

DID YOU KNOW?
- The average sale price is DOWN 22% from this time last year
- Inventory levels continue to be in favour of Sellers, however, there is a shift in the market, with 2.1 months of inventory in the City of Peterborough (that means it would take 63 days to completely sell the homes that are currently listed for sale in the city, based on the the current rate of sales activity)
- Houses in the North end of Peterborough are selling the most – with 20 sales last month
** Important to Note:
- When months of inventory goes up, prices come down, and when months of inventory goes down, prices go up (the law of supply and demand)
- A seller’s market = 4 months of inventory or less and a balanced market = 4-6 months of inventory.
Take a look at the market snapshot for January 2023, and reach out if you have any questions. Whether you are buying, selling, investing or just daydreaming about a new home, I can help you make an informed decision.